
Changzhou Tenglong AutoPartsCo.Ltd's (SHSE:603158) stock is up by a considerable 30% over the past three months. Given that stock prices are usually aligned with a company's financial performance in the long-term, we decided to study its financial indicators more closely to see if they had a hand to play in the recent price move. Specifically, we decided to study Changzhou Tenglong AutoPartsCo.Ltd's ROE in this article.
Return on Equity or ROE is a test of how effectively a company is growing its value and managing investors' money. In simpler terms, it measures the profitability of a company in relation to shareholder's equity.
See our latest analysis for Changzhou Tenglong AutoPartsCo.Ltd
How To Calculate Return On Equity?
The formula for ROE is:
Return on Equity = Net Profit (from continuing operations) ÷ Shareholders' Equity
So, based on the above formula, the ROE for Changzhou Tenglong AutoPartsCo.Ltd is:
4.2% = CN¥91m ÷ CN¥2.2b (Based on the trailing twelve months to March 2022).
The 'return' is the yearly profit. That means that for every CN¥1 worth of shareholders' equity, the company generated CN¥0.04 in profit.
What Has ROE Got To Do With Earnings Growth?
Thus far, we have learned that ROE measures how efficiently a company is generating its profits. Depending on how much of these profits the company reinvests or "retains", and how effectively it does so, we are then able to assess a company's earnings growth potential. Assuming everything else remains unchanged, the higher the ROE and profit retention, the higher the growth rate of a company compared to companies that don't necessarily bear these characteristics.
A Side By Side comparison of Changzhou Tenglong AutoPartsCo.Ltd's Earnings Growth And 4.2% ROE
As you can see, Changzhou Tenglong AutoPartsCo.Ltd's ROE looks pretty weak. Not just that, even compared to the industry average of 6.6%, the company's ROE is entirely unremarkable. Therefore, Changzhou Tenglong AutoPartsCo.Ltd's flat earnings over the past five years can possibly be explained by the low ROE amongst other factors.
We then compared Changzhou Tenglong AutoPartsCo.Ltd's net income growth with the industry and we're pleased to see that the company's growth figure is higher when compared with the industry which has a growth rate of 1.0% in the same period.
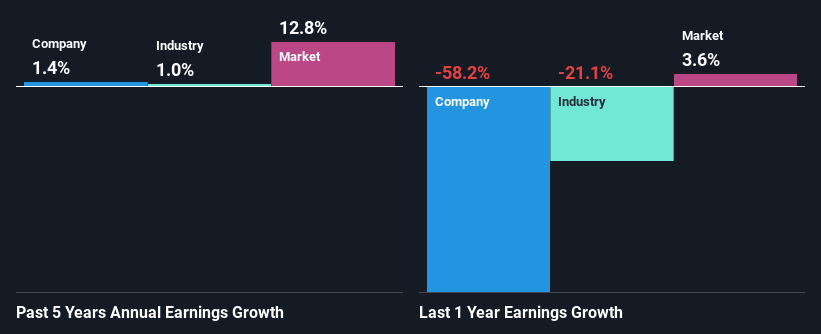 SHSE:603158 Past Earnings Growth August 26th 2022
The basis for attaching value to a company is, to a great extent, tied to its earnings growth. It's important for an investor to know whether the market has priced in the company's expected earnings growth (or decline). This then helps them determine if the stock is placed for a bright or bleak future. If you're wondering about Changzhou Tenglong AutoPartsCo.Ltd's's valuation, check out this gauge of its price-to-earnings ratio, as compared to its industry.
Is Changzhou Tenglong AutoPartsCo.Ltd Efficiently Re-investing Its Profits?
Changzhou Tenglong AutoPartsCo.Ltd's low three-year median payout ratio of 21%, (meaning the company retains79% of profits) should mean that the company is retaining most of its earnings and consequently, should see higher growth than it has reported.
Additionally, Changzhou Tenglong AutoPartsCo.Ltd has paid dividends over a period of six years, which means that the company's management is determined to pay dividends even if it means little to no earnings growth.
Conclusion
Overall, we feel that Changzhou Tenglong AutoPartsCo.Ltd certainly does have some positive factors to consider. Despite its low rate of return, the fact that the company reinvests a very high portion of its profits into its business, no doubt contributed to its high earnings growth. So far, we've only made a quick discussion around the company's earnings growth. You can do your own research on Changzhou Tenglong AutoPartsCo.Ltd and see how it has performed in the past by looking at this FREE detailed graph of past earnings, revenue and cash flows.
Have feedback on this article? Concerned about the content? Get in touch with us directly. Alternatively, email editorial-team (at) simplywallst.com.
This article by Simply Wall St is general in nature. We provide commentary based on historical data and analyst forecasts only using an unbiased methodology and our articles are not intended to be financial advice. It does not constitute a recommendation to buy or sell any stock, and does not take account of your objectives, or your financial situation. We aim to bring you long-term focused analysis driven by fundamental data. Note that our analysis may not factor in the latest price-sensitive company announcements or qualitative material. Simply Wall St has no position in any stocks mentioned.