
Some say volatility, rather than debt, is the best way to think about risk as an investor, but Warren Buffett famously said that 'Volatility is far from synonymous with risk.' When we think about how risky a company is, we always like to look at its use of debt, since debt overload can lead to ruin. We note that Grand Ming Group Holdings Limited (HKG:1271) does have debt on its balance sheet. But should shareholders be worried about its use of debt?
When Is Debt A Problem?
Debt is a tool to help businesses grow, but if a business is incapable of paying off its lenders, then it exists at their mercy. If things get really bad, the lenders can take control of the business. However, a more frequent (but still costly) occurrence is where a company must issue shares at bargain-basement prices, permanently diluting shareholders, just to shore up its balance sheet. Having said that, the most common situation is where a company manages its debt reasonably well - and to its own advantage. The first step when considering a company's debt levels is to consider its cash and debt together.
View our latest analysis for Grand Ming Group Holdings
What Is Grand Ming Group Holdings's Net Debt?
You can click the graphic below for the historical numbers, but it shows that as of March 2022 Grand Ming Group Holdings had HK$4.91b of debt, an increase on HK$4.04b, over one year. However, it also had HK$201.9m in cash, and so its net debt is HK$4.71b.
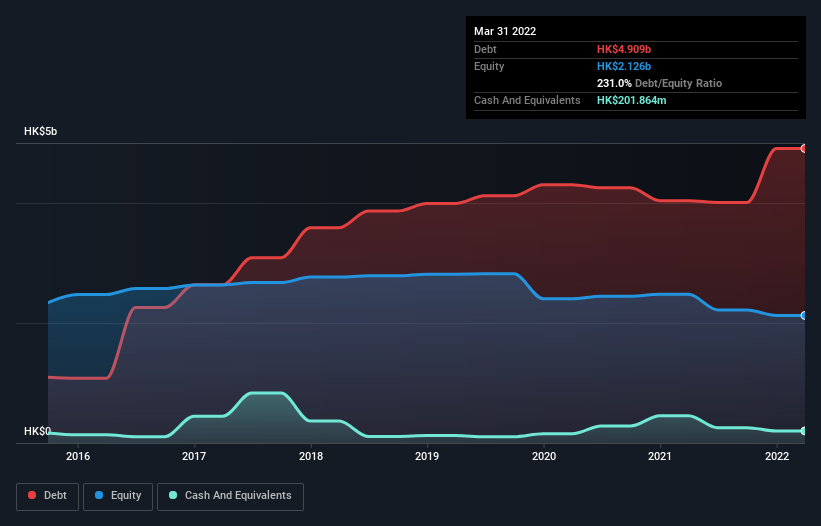 SEHK:1271 Debt to Equity History August 15th 2022
How Strong Is Grand Ming Group Holdings' Balance Sheet?
Zooming in on the latest balance sheet data, we can see that Grand Ming Group Holdings had liabilities of HK$8.49b due within 12 months and liabilities of HK$61.8m due beyond that. On the other hand, it had cash of HK$201.9m and HK$299.0m worth of receivables due within a year. So its liabilities outweigh the sum of its cash and (near-term) receivables by HK$8.05b.
This deficit is considerable relative to its market capitalization of HK$9.94b, so it does suggest shareholders should keep an eye on Grand Ming Group Holdings' use of debt. Should its lenders demand that it shore up the balance sheet, shareholders would likely face severe dilution. When analysing debt levels, the balance sheet is the obvious place to start. But you can't view debt in total isolation; since Grand Ming Group Holdings will need earnings to service that debt. So when considering debt, it's definitely worth looking at the earnings trend. Click here for an interactive snapshot.
In the last year Grand Ming Group Holdings had a loss before interest and tax, and actually shrunk its revenue by 45%, to HK$818m. To be frank that doesn't bode well.
Caveat Emptor
While Grand Ming Group Holdings's falling revenue is about as heartwarming as a wet blanket, arguably its earnings before interest and tax (EBIT) loss is even less appealing. To be specific the EBIT loss came in at HK$13m. Considering that alongside the liabilities mentioned above does not give us much confidence that company should be using so much debt. So we think its balance sheet is a little strained, though not beyond repair. However, it doesn't help that it burned through HK$21m of cash over the last year. So to be blunt we think it is risky. When analysing debt levels, the balance sheet is the obvious place to start. But ultimately, every company can contain risks that exist outside of the balance sheet. Case in point: We've spotted 5 warning signs for Grand Ming Group Holdings you should be aware of, and 3 of them are a bit unpleasant.
If you're interested in investing in businesses that can grow profits without the burden of debt, then check out this free list of growing businesses that have net cash on the balance sheet.
Have feedback on this article? Concerned about the content? Get in touch with us directly. Alternatively, email editorial-team (at) simplywallst.com.
This article by Simply Wall St is general in nature. We provide commentary based on historical data and analyst forecasts only using an unbiased methodology and our articles are not intended to be financial advice. It does not constitute a recommendation to buy or sell any stock, and does not take account of your objectives, or your financial situation. We aim to bring you long-term focused analysis driven by fundamental data. Note that our analysis may not factor in the latest price-sensitive company announcements or qualitative material. Simply Wall St has no position in any stocks mentioned.