
The worst result, after buying shares in a company (assuming no leverage), would be if you lose all the money you put in. But when you pick a company that is really flourishing, you can make more than 100%. For example, the Ningbo Yongxin Optics Co.,Ltd (SHSE:603297) share price has soared 271% in the last three years. That sort of return is as solid as granite. It's also good to see the share price up 50% over the last quarter.
After a strong gain in the past week, it's worth seeing if longer term returns have been driven by improving fundamentals.
Check out our latest analysis for Ningbo Yongxin OpticsLtd
In his essay The Superinvestors of Graham-and-Doddsville Warren Buffett described how share prices do not always rationally reflect the value of a business. One imperfect but simple way to consider how the market perception of a company has shifted is to compare the change in the earnings per share (EPS) with the share price movement.
Ningbo Yongxin OpticsLtd was able to grow its EPS at 13% per year over three years, sending the share price higher. In comparison, the 55% per year gain in the share price outpaces the EPS growth. This indicates that the market is feeling more optimistic on the stock, after the last few years of progress. It is quite common to see investors become enamoured with a business, after a few years of solid progress. This favorable sentiment is reflected in its (fairly optimistic) P/E ratio of 70.48.
You can see below how EPS has changed over time (discover the exact values by clicking on the image).
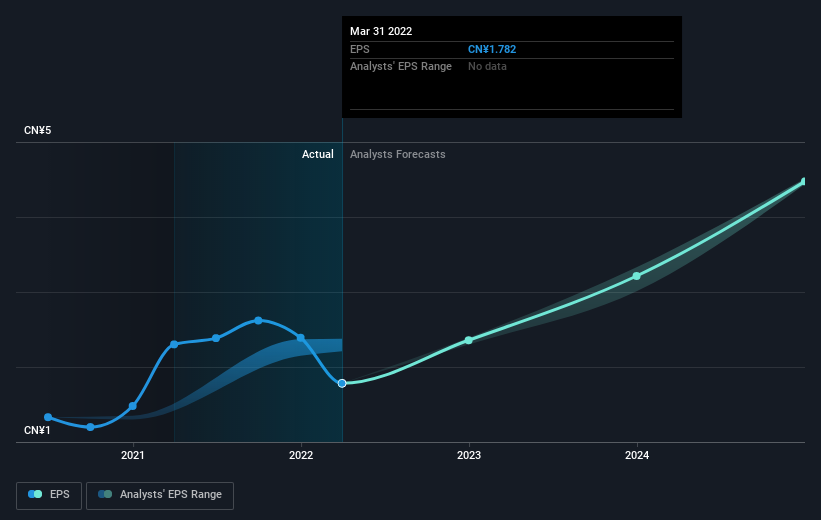 SHSE:603297 Earnings Per Share Growth August 11th 2022
Before buying or selling a stock, we always recommend a close examination of historic growth trends, available here.
What About Dividends?
As well as measuring the share price return, investors should also consider the total shareholder return (TSR). Whereas the share price return only reflects the change in the share price, the TSR includes the value of dividends (assuming they were reinvested) and the benefit of any discounted capital raising or spin-off. It's fair to say that the TSR gives a more complete picture for stocks that pay a dividend. As it happens, Ningbo Yongxin OpticsLtd's TSR for the last 3 years was 283%, which exceeds the share price return mentioned earlier. The dividends paid by the company have thusly boosted the total shareholder return.
A Different Perspective
We're pleased to report that Ningbo Yongxin OpticsLtd rewarded shareholders with a total shareholder return of 118% over the last year. That's including the dividend. That gain actually surpasses the 56% TSR it generated (per year) over three years. Given the track record of solid returns over varying time frames, it might be worth putting Ningbo Yongxin OpticsLtd on your watchlist. It's always interesting to track share price performance over the longer term. But to understand Ningbo Yongxin OpticsLtd better, we need to consider many other factors. Take risks, for example - Ningbo Yongxin OpticsLtd has 3 warning signs we think you should be aware of.
Of course, you might find a fantastic investment by looking elsewhere. So take a peek at this free list of companies we expect will grow earnings.
Please note, the market returns quoted in this article reflect the market weighted average returns of stocks that currently trade on CN exchanges.
Have feedback on this article? Concerned about the content? Get in touch with us directly. Alternatively, email editorial-team (at) simplywallst.com.
This article by Simply Wall St is general in nature. We provide commentary based on historical data and analyst forecasts only using an unbiased methodology and our articles are not intended to be financial advice. It does not constitute a recommendation to buy or sell any stock, and does not take account of your objectives, or your financial situation. We aim to bring you long-term focused analysis driven by fundamental data. Note that our analysis may not factor in the latest price-sensitive company announcements or qualitative material. Simply Wall St has no position in any stocks mentioned.