
The most you can lose on any stock (assuming you don't use leverage) is 100% of your money. But on the bright side, if you buy shares in a high quality company at the right price, you can gain well over 100%. For instance, the price of C&D International Investment Group Limited (HKG:1908) stock is up an impressive 243% over the last five years. It's down 4.9% in the last seven days.
While this past week has detracted from the company's five-year return, let's look at the recent trends of the underlying business and see if the gains have been in alignment.
Check out our latest analysis for C&D International Investment Group
To paraphrase Benjamin Graham: Over the short term the market is a voting machine, but over the long term it's a weighing machine. One flawed but reasonable way to assess how sentiment around a company has changed is to compare the earnings per share (EPS) with the share price.
During the last half decade, C&D International Investment Group became profitable. That kind of transition can be an inflection point that justifies a strong share price gain, just as we have seen here. Given that the company made a profit three years ago, but not five years ago, it is worth looking at the share price returns over the last three years, too. We can see that the C&D International Investment Group share price is up 116% in the last three years. In the same period, EPS is up 1.0% per year. This EPS growth is lower than the 29% average annual increase in the share price over three years. So it's fair to assume the market has a higher opinion of the business than it did three years ago.
The image below shows how EPS has tracked over time (if you click on the image you can see greater detail).
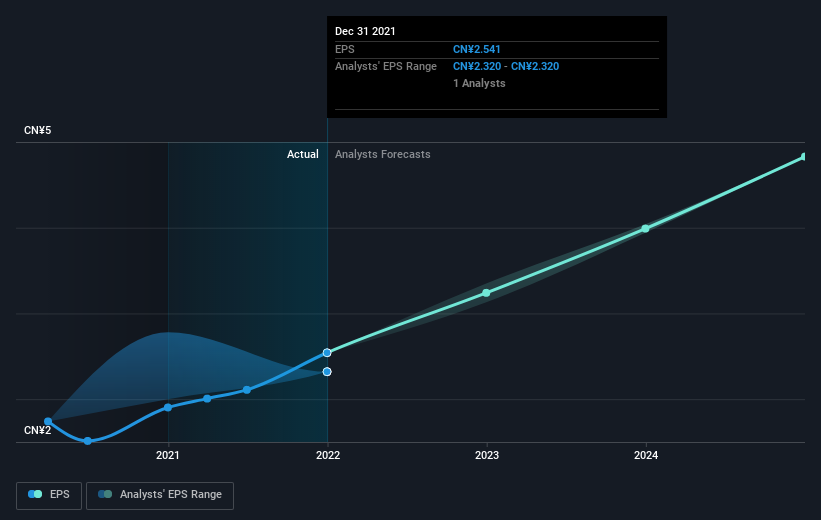 SEHK:1908 Earnings Per Share Growth August 11th 2022
We know that C&D International Investment Group has improved its bottom line lately, but is it going to grow revenue? Check if analysts think C&D International Investment Group will grow revenue in the future.
What About Dividends?
As well as measuring the share price return, investors should also consider the total shareholder return (TSR). The TSR incorporates the value of any spin-offs or discounted capital raisings, along with any dividends, based on the assumption that the dividends are reinvested. Arguably, the TSR gives a more comprehensive picture of the return generated by a stock. As it happens, C&D International Investment Group's TSR for the last 5 years was 535%, which exceeds the share price return mentioned earlier. The dividends paid by the company have thusly boosted the total shareholder return.
A Different Perspective
It's nice to see that C&D International Investment Group shareholders have received a total shareholder return of 33% over the last year. And that does include the dividend. Having said that, the five-year TSR of 45% a year, is even better. It's always interesting to track share price performance over the longer term. But to understand C&D International Investment Group better, we need to consider many other factors. Consider for instance, the ever-present spectre of investment risk. We've identified 3 warning signs with C&D International Investment Group (at least 1 which is concerning) , and understanding them should be part of your investment process.
But note: C&D International Investment Group may not be the best stock to buy. So take a peek at this free list of interesting companies with past earnings growth (and further growth forecast).
Please note, the market returns quoted in this article reflect the market weighted average returns of stocks that currently trade on HK exchanges.
Have feedback on this article? Concerned about the content? Get in touch with us directly. Alternatively, email editorial-team (at) simplywallst.com.
This article by Simply Wall St is general in nature. We provide commentary based on historical data and analyst forecasts only using an unbiased methodology and our articles are not intended to be financial advice. It does not constitute a recommendation to buy or sell any stock, and does not take account of your objectives, or your financial situation. We aim to bring you long-term focused analysis driven by fundamental data. Note that our analysis may not factor in the latest price-sensitive company announcements or qualitative material. Simply Wall St has no position in any stocks mentioned.