
By buying an index fund, you can roughly match the market return with ease. But if you pick the right individual stocks, you could make more than that. For example, CIMC Enric Holdings Limited (HKG:3899) shareholders have seen the share price rise 51% over three years, well in excess of the market decline (7.9%, not including dividends).
On the back of a solid 7-day performance, let's check what role the company's fundamentals have played in driving long term shareholder returns.
Check out our latest analysis for CIMC Enric Holdings
In his essay The Superinvestors of Graham-and-Doddsville Warren Buffett described how share prices do not always rationally reflect the value of a business. One imperfect but simple way to consider how the market perception of a company has shifted is to compare the change in the earnings per share (EPS) with the share price movement.
During three years of share price growth, CIMC Enric Holdings achieved compound earnings per share growth of 2.6% per year. This EPS growth is lower than the 15% average annual increase in the share price. So it's fair to assume the market has a higher opinion of the business than it did three years ago. It is quite common to see investors become enamoured with a business, after a few years of solid progress.
You can see below how EPS has changed over time (discover the exact values by clicking on the image).
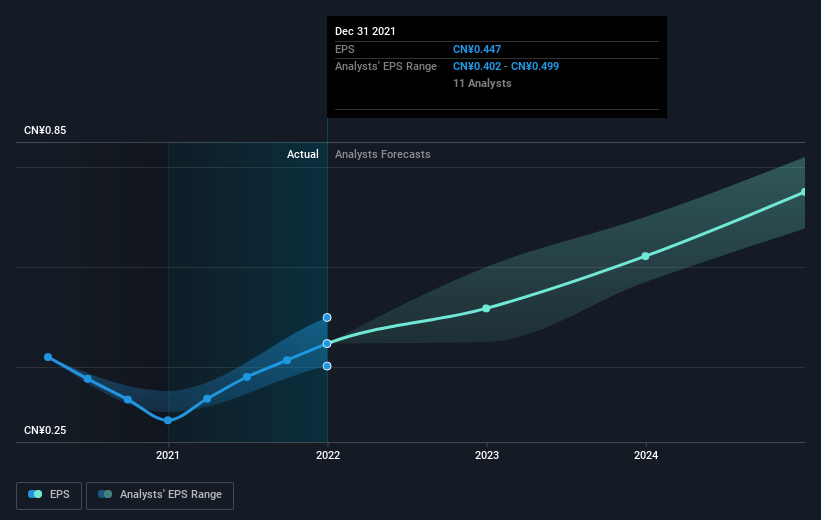 SEHK:3899 Earnings Per Share Growth August 9th 2022
We know that CIMC Enric Holdings has improved its bottom line lately, but is it going to grow revenue? Check if analysts think CIMC Enric Holdings will grow revenue in the future.
What About Dividends?
When looking at investment returns, it is important to consider the difference between total shareholder return (TSR) and share price return. Whereas the share price return only reflects the change in the share price, the TSR includes the value of dividends (assuming they were reinvested) and the benefit of any discounted capital raising or spin-off. It's fair to say that the TSR gives a more complete picture for stocks that pay a dividend. As it happens, CIMC Enric Holdings' TSR for the last 3 years was 67%, which exceeds the share price return mentioned earlier. This is largely a result of its dividend payments!
A Different Perspective
While it's never nice to take a loss, CIMC Enric Holdings shareholders can take comfort that , including dividends,their trailing twelve month loss of 9.5% wasn't as bad as the market loss of around 19%. Longer term investors wouldn't be so upset, since they would have made 10%, each year, over five years. In the best case scenario the last year is just a temporary blip on the journey to a brighter future. If you would like to research CIMC Enric Holdings in more detail then you might want to take a look at whether insiders have been buying or selling shares in the company.
But note: CIMC Enric Holdings may not be the best stock to buy. So take a peek at this free list of interesting companies with past earnings growth (and further growth forecast).
Please note, the market returns quoted in this article reflect the market weighted average returns of stocks that currently trade on HK exchanges.
Have feedback on this article? Concerned about the content? Get in touch with us directly. Alternatively, email editorial-team (at) simplywallst.com.
This article by Simply Wall St is general in nature. We provide commentary based on historical data and analyst forecasts only using an unbiased methodology and our articles are not intended to be financial advice. It does not constitute a recommendation to buy or sell any stock, and does not take account of your objectives, or your financial situation. We aim to bring you long-term focused analysis driven by fundamental data. Note that our analysis may not factor in the latest price-sensitive company announcements or qualitative material. Simply Wall St has no position in any stocks mentioned.