
It's easy to feel disappointed if you buy a stock that goes down. But in the short term the market is a voting machine, and the share price movements may not reflect the underlying business performance. So while the Radiance Holdings (Group) Company Limited (HKG:9993) share price is down 13% in the last year, the total return to shareholders (which includes dividends) was -9.1%. And that total return actually beats the market decline of 19%. Because Radiance Holdings (Group) hasn't been listed for many years, the market is still learning about how the business performs. Unfortunately the share price momentum is still quite negative, with prices down 12% in thirty days. But this could be related to poor market conditions -- stocks are down 6.9% in the same time.
After losing 4.7% this past week, it's worth investigating the company's fundamentals to see what we can infer from past performance.
See our latest analysis for Radiance Holdings (Group)
While the efficient markets hypothesis continues to be taught by some, it has been proven that markets are over-reactive dynamic systems, and investors are not always rational. One flawed but reasonable way to assess how sentiment around a company has changed is to compare the earnings per share (EPS) with the share price.
Unhappily, Radiance Holdings (Group) had to report a 9.2% decline in EPS over the last year. The share price decline of 13% is actually more than the EPS drop. So it seems the market was too confident about the business, a year ago. The less favorable sentiment is reflected in its current P/E ratio of 4.07.
You can see below how EPS has changed over time (discover the exact values by clicking on the image).
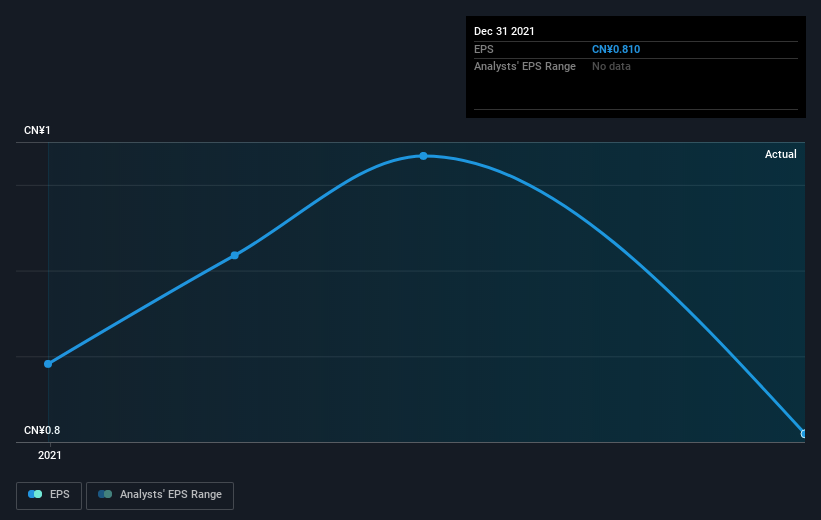 SEHK:9993 Earnings Per Share Growth August 9th 2022
It might be well worthwhile taking a look at our free report on Radiance Holdings (Group)'s earnings, revenue and cash flow.
What About Dividends?
As well as measuring the share price return, investors should also consider the total shareholder return (TSR). Whereas the share price return only reflects the change in the share price, the TSR includes the value of dividends (assuming they were reinvested) and the benefit of any discounted capital raising or spin-off. Arguably, the TSR gives a more comprehensive picture of the return generated by a stock. We note that for Radiance Holdings (Group) the TSR over the last 1 year was -9.1%, which is better than the share price return mentioned above. And there's no prize for guessing that the dividend payments largely explain the divergence!
A Different Perspective
Given that the broader market dropped 19% over the year, the fact that Radiance Holdings (Group) shareholders were down 9.1% isn't so bad. Unfortunately for shareholders, the share price momentum hasn't improved much with the stock down 8.8% in around 90 days. This doesn't look great to us, but it is possible that the market is over-reacting to prior disappointment. While it is well worth considering the different impacts that market conditions can have on the share price, there are other factors that are even more important. Take risks, for example - Radiance Holdings (Group) has 2 warning signs (and 1 which can't be ignored) we think you should know about.
Of course, you might find a fantastic investment by looking elsewhere. So take a peek at this free list of companies we expect will grow earnings.
Please note, the market returns quoted in this article reflect the market weighted average returns of stocks that currently trade on HK exchanges.
Have feedback on this article? Concerned about the content? Get in touch with us directly. Alternatively, email editorial-team (at) simplywallst.com.
This article by Simply Wall St is general in nature. We provide commentary based on historical data and analyst forecasts only using an unbiased methodology and our articles are not intended to be financial advice. It does not constitute a recommendation to buy or sell any stock, and does not take account of your objectives, or your financial situation. We aim to bring you long-term focused analysis driven by fundamental data. Note that our analysis may not factor in the latest price-sensitive company announcements or qualitative material. Simply Wall St has no position in any stocks mentioned.