
The most you can lose on any stock (assuming you don't use leverage) is 100% of your money. But when you pick a company that is really flourishing, you can make more than 100%. For example, the Zhejiang Huangma Technology Co.,Ltd (SHSE:603181) share price has soared 149% in the last three years. That sort of return is as solid as granite. In the last week the share price is up 4.7%.
On the back of a solid 7-day performance, let's check what role the company's fundamentals have played in driving long term shareholder returns.
See our latest analysis for Zhejiang Huangma TechnologyLtd
While the efficient markets hypothesis continues to be taught by some, it has been proven that markets are over-reactive dynamic systems, and investors are not always rational. By comparing earnings per share (EPS) and share price changes over time, we can get a feel for how investor attitudes to a company have morphed over time.
Zhejiang Huangma TechnologyLtd was able to grow its EPS at 32% per year over three years, sending the share price higher. We don't think it is entirely coincidental that the EPS growth is reasonably close to the 36% average annual increase in the share price. This observation indicates that the market's attitude to the business hasn't changed all that much. Au contraire, the share price change has arguably mimicked the EPS growth.
You can see how EPS has changed over time in the image below (click on the chart to see the exact values).
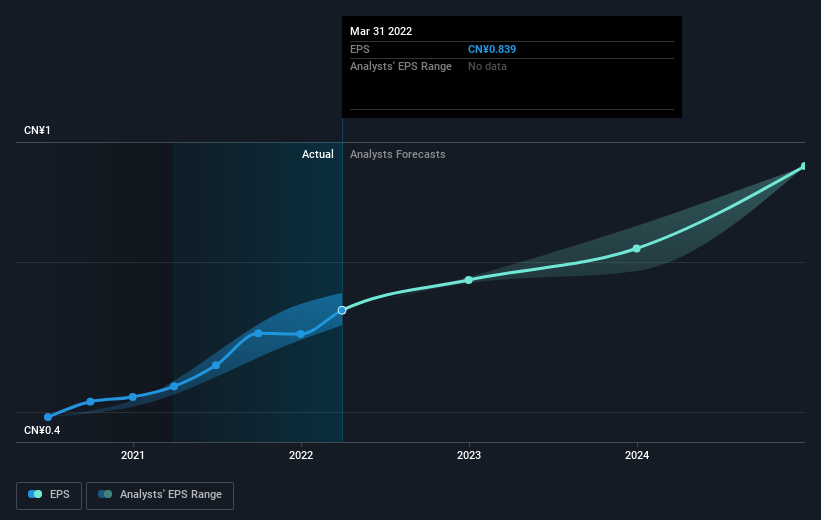 SHSE:603181 Earnings Per Share Growth August 9th 2022
We know that Zhejiang Huangma TechnologyLtd has improved its bottom line over the last three years, but what does the future have in store? It might be well worthwhile taking a look at our free report on how its financial position has changed over time.
What About Dividends?
When looking at investment returns, it is important to consider the difference between total shareholder return (TSR) and share price return. Whereas the share price return only reflects the change in the share price, the TSR includes the value of dividends (assuming they were reinvested) and the benefit of any discounted capital raising or spin-off. So for companies that pay a generous dividend, the TSR is often a lot higher than the share price return. As it happens, Zhejiang Huangma TechnologyLtd's TSR for the last 3 years was 155%, which exceeds the share price return mentioned earlier. And there's no prize for guessing that the dividend payments largely explain the divergence!
A Different Perspective
We're pleased to report that Zhejiang Huangma TechnologyLtd rewarded shareholders with a total shareholder return of 37% over the last year. And yes, that does include the dividend. So this year's TSR was actually better than the three-year TSR (annualized) of 37%. These improved returns may hint at some real business momentum, implying that now could be a great time to delve deeper. It's always interesting to track share price performance over the longer term. But to understand Zhejiang Huangma TechnologyLtd better, we need to consider many other factors. Even so, be aware that Zhejiang Huangma TechnologyLtd is showing 2 warning signs in our investment analysis , and 1 of those can't be ignored...
For those who like to find winning investments this free list of growing companies with recent insider purchasing, could be just the ticket.
Please note, the market returns quoted in this article reflect the market weighted average returns of stocks that currently trade on CN exchanges.
Have feedback on this article? Concerned about the content? Get in touch with us directly. Alternatively, email editorial-team (at) simplywallst.com.
This article by Simply Wall St is general in nature. We provide commentary based on historical data and analyst forecasts only using an unbiased methodology and our articles are not intended to be financial advice. It does not constitute a recommendation to buy or sell any stock, and does not take account of your objectives, or your financial situation. We aim to bring you long-term focused analysis driven by fundamental data. Note that our analysis may not factor in the latest price-sensitive company announcements or qualitative material. Simply Wall St has no position in any stocks mentioned.