
One simple way to benefit from the stock market is to buy an index fund. But many of us dare to dream of bigger returns, and build a portfolio ourselves. Just take a look at Geely Automobile Holdings Limited (HKG:175), which is up 61%, over three years, soundly beating the market decline of 8.3% (not including dividends).
On the back of a solid 7-day performance, let's check what role the company's fundamentals have played in driving long term shareholder returns.
Check out our latest analysis for Geely Automobile Holdings
While markets are a powerful pricing mechanism, share prices reflect investor sentiment, not just underlying business performance. One imperfect but simple way to consider how the market perception of a company has shifted is to compare the change in the earnings per share (EPS) with the share price movement.
Over the last three years, Geely Automobile Holdings failed to grow earnings per share, which fell 30% (annualized).
So we doubt that the market is looking to EPS for its main judge of the company's value. Therefore, we think it's worth considering other metrics as well.
Languishing at just 1.1%, we doubt the dividend is doing much to prop up the share price. The revenue drop of 1.5% is as underwhelming as some politicians. What's clear is that historic earnings and revenue aren't matching up with the share price action, very well. So you might have to dig deeper to get a grasp of the situation
The graphic below depicts how earnings and revenue have changed over time (unveil the exact values by clicking on the image).
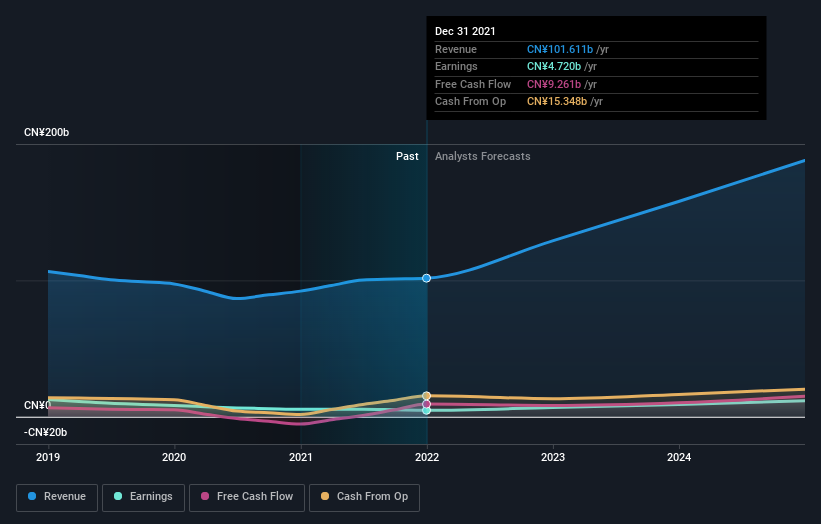 SEHK:175 Earnings and Revenue Growth August 8th 2022
We like that insiders have been buying shares in the last twelve months. Even so, future earnings will be far more important to whether current shareholders make money. You can see what analysts are predicting for Geely Automobile Holdings in this interactive graph of future profit estimates.
What About Dividends?
As well as measuring the share price return, investors should also consider the total shareholder return (TSR). Whereas the share price return only reflects the change in the share price, the TSR includes the value of dividends (assuming they were reinvested) and the benefit of any discounted capital raising or spin-off. It's fair to say that the TSR gives a more complete picture for stocks that pay a dividend. As it happens, Geely Automobile Holdings' TSR for the last 3 years was 68%, which exceeds the share price return mentioned earlier. And there's no prize for guessing that the dividend payments largely explain the divergence!
A Different Perspective
While the broader market lost about 17% in the twelve months, Geely Automobile Holdings shareholders did even worse, losing 34% (even including dividends). Having said that, it's inevitable that some stocks will be oversold in a falling market. The key is to keep your eyes on the fundamental developments. On the bright side, long term shareholders have made money, with a gain of 1.1% per year over half a decade. If the fundamental data continues to indicate long term sustainable growth, the current sell-off could be an opportunity worth considering. While it is well worth considering the different impacts that market conditions can have on the share price, there are other factors that are even more important. For instance, we've identified 1 warning sign for Geely Automobile Holdings that you should be aware of.
If you like to buy stocks alongside management, then you might just love this free list of companies. (Hint: insiders have been buying them).
Please note, the market returns quoted in this article reflect the market weighted average returns of stocks that currently trade on HK exchanges.
Have feedback on this article? Concerned about the content? Get in touch with us directly. Alternatively, email editorial-team (at) simplywallst.com.
This article by Simply Wall St is general in nature. We provide commentary based on historical data and analyst forecasts only using an unbiased methodology and our articles are not intended to be financial advice. It does not constitute a recommendation to buy or sell any stock, and does not take account of your objectives, or your financial situation. We aim to bring you long-term focused analysis driven by fundamental data. Note that our analysis may not factor in the latest price-sensitive company announcements or qualitative material. Simply Wall St has no position in any stocks mentioned.