
The external fund manager backed by Berkshire Hathaway's Charlie Munger, Li Lu, makes no bones about it when he says 'The biggest investment risk is not the volatility of prices, but whether you will suffer a permanent loss of capital.' So it might be obvious that you need to consider debt, when you think about how risky any given stock is, because too much debt can sink a company. Importantly, Poly Developments and Holdings Group Co., Ltd. (SHSE:600048) does carry debt. But is this debt a concern to shareholders?
When Is Debt Dangerous?
Debt assists a business until the business has trouble paying it off, either with new capital or with free cash flow. Ultimately, if the company can't fulfill its legal obligations to repay debt, shareholders could walk away with nothing. However, a more frequent (but still costly) occurrence is where a company must issue shares at bargain-basement prices, permanently diluting shareholders, just to shore up its balance sheet. Of course, the upside of debt is that it often represents cheap capital, especially when it replaces dilution in a company with the ability to reinvest at high rates of return. When we think about a company's use of debt, we first look at cash and debt together.
See our latest analysis for Poly Developments and Holdings Group
What Is Poly Developments and Holdings Group's Net Debt?
As you can see below, at the end of March 2022, Poly Developments and Holdings Group had CN¥366.3b of debt, up from CN¥333.7b a year ago. Click the image for more detail. However, it also had CN¥137.6b in cash, and so its net debt is CN¥228.7b.
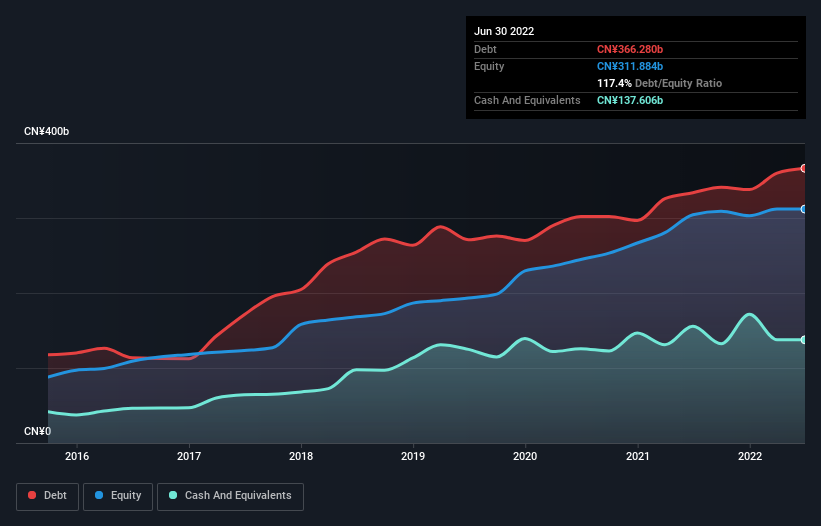 SHSE:600048 Debt to Equity History August 7th 2022
A Look At Poly Developments and Holdings Group's Liabilities
The latest balance sheet data shows that Poly Developments and Holdings Group had liabilities of CN¥820.4b due within a year, and liabilities of CN¥297.5b falling due after that. Offsetting this, it had CN¥137.6b in cash and CN¥159.6b in receivables that were due within 12 months. So it has liabilities totalling CN¥820.7b more than its cash and near-term receivables, combined.
The deficiency here weighs heavily on the CN¥183.9b company itself, as if a child were struggling under the weight of an enormous back-pack full of books, his sports gear, and a trumpet. So we'd watch its balance sheet closely, without a doubt. At the end of the day, Poly Developments and Holdings Group would probably need a major re-capitalization if its creditors were to demand repayment.
We use two main ratios to inform us about debt levels relative to earnings. The first is net debt divided by earnings before interest, tax, depreciation, and amortization (EBITDA), while the second is how many times its earnings before interest and tax (EBIT) covers its interest expense (or its interest cover, for short). The advantage of this approach is that we take into account both the absolute quantum of debt (with net debt to EBITDA) and the actual interest expenses associated with that debt (with its interest cover ratio).
Poly Developments and Holdings Group's net debt is 4.7 times its EBITDA, which is a significant but still reasonable amount of leverage. But its EBIT was about 1k times its interest expense, implying the company isn't really paying a high cost to maintain that level of debt. Even were the low cost to prove unsustainable, that is a good sign. Sadly, Poly Developments and Holdings Group's EBIT actually dropped 6.9% in the last year. If that earnings trend continues then its debt load will grow heavy like the heart of a polar bear watching its sole cub. There's no doubt that we learn most about debt from the balance sheet. But it is future earnings, more than anything, that will determine Poly Developments and Holdings Group's ability to maintain a healthy balance sheet going forward. So if you want to see what the professionals think, you might find this free report on analyst profit forecasts to be interesting.
But our final consideration is also important, because a company cannot pay debt with paper profits; it needs cold hard cash. So it's worth checking how much of that EBIT is backed by free cash flow. Over the last three years, Poly Developments and Holdings Group reported free cash flow worth 9.0% of its EBIT, which is really quite low. That limp level of cash conversion undermines its ability to manage and pay down debt.
Our View
Mulling over Poly Developments and Holdings Group's attempt at staying on top of its total liabilities, we're certainly not enthusiastic. But on the bright side, its interest cover is a good sign, and makes us more optimistic. We're quite clear that we consider Poly Developments and Holdings Group to be really rather risky, as a result of its balance sheet health. So we're almost as wary of this stock as a hungry kitten is about falling into its owner's fish pond: once bitten, twice shy, as they say. When analysing debt levels, the balance sheet is the obvious place to start. However, not all investment risk resides within the balance sheet - far from it. For example Poly Developments and Holdings Group has 2 warning signs (and 1 which makes us a bit uncomfortable) we think you should know about.
Of course, if you're the type of investor who prefers buying stocks without the burden of debt, then don't hesitate to discover our exclusive list of net cash growth stocks, today.
Have feedback on this article? Concerned about the content? Get in touch with us directly. Alternatively, email editorial-team (at) simplywallst.com.
This article by Simply Wall St is general in nature. We provide commentary based on historical data and analyst forecasts only using an unbiased methodology and our articles are not intended to be financial advice. It does not constitute a recommendation to buy or sell any stock, and does not take account of your objectives, or your financial situation. We aim to bring you long-term focused analysis driven by fundamental data. Note that our analysis may not factor in the latest price-sensitive company announcements or qualitative material. Simply Wall St has no position in any stocks mentioned.