
Many investors define successful investing as beating the market average over the long term. But in any portfolio, there are likely to be some stocks that fall short of that benchmark. Unfortunately, that's been the case for longer term SSY Group Limited (HKG:2005) shareholders, since the share price is down 35% in the last three years, falling well short of the market decline of around 4.1%. More recently, the share price has dropped a further 13% in a month. However, we note the price may have been impacted by the broader market, which is down 6.3% in the same time period.
If the past week is anything to go by, investor sentiment for SSY Group isn't positive, so let's see if there's a mismatch between fundamentals and the share price.
View our latest analysis for SSY Group
To paraphrase Benjamin Graham: Over the short term the market is a voting machine, but over the long term it's a weighing machine. By comparing earnings per share (EPS) and share price changes over time, we can get a feel for how investor attitudes to a company have morphed over time.
SSY Group saw its EPS decline at a compound rate of 4.8% per year, over the last three years. This reduction in EPS is slower than the 13% annual reduction in the share price. So it's likely that the EPS decline has disappointed the market, leaving investors hesitant to buy.
The image below shows how EPS has tracked over time (if you click on the image you can see greater detail).
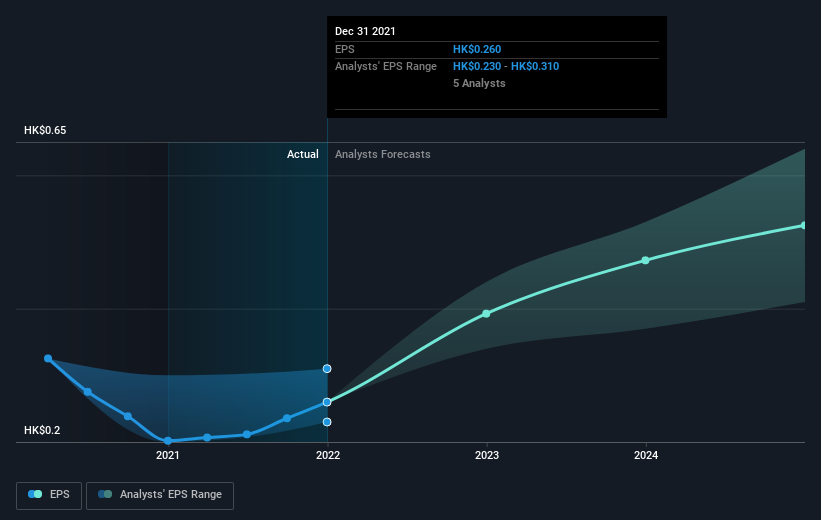 SEHK:2005 Earnings Per Share Growth August 7th 2022
We know that SSY Group has improved its bottom line lately, but is it going to grow revenue? If you're interested, you could check this free report showing consensus revenue forecasts.
What About Dividends?
When looking at investment returns, it is important to consider the difference between total shareholder return (TSR) and share price return. The TSR incorporates the value of any spin-offs or discounted capital raisings, along with any dividends, based on the assumption that the dividends are reinvested. It's fair to say that the TSR gives a more complete picture for stocks that pay a dividend. In the case of SSY Group, it has a TSR of -31% for the last 3 years. That exceeds its share price return that we previously mentioned. This is largely a result of its dividend payments!
A Different Perspective
The total return of 18% received by SSY Group shareholders over the last year isn't far from the market return of -17%. The silver lining is that longer term investors would have made a total return of 6% per year over half a decade. If the stock price has been impacted by changing sentiment, rather than deteriorating business conditions, it could spell opportunity. It's always interesting to track share price performance over the longer term. But to understand SSY Group better, we need to consider many other factors. For instance, we've identified 1 warning sign for SSY Group that you should be aware of.
If you are like me, then you will not want to miss this free list of growing companies that insiders are buying.
Please note, the market returns quoted in this article reflect the market weighted average returns of stocks that currently trade on HK exchanges.
Have feedback on this article? Concerned about the content? Get in touch with us directly. Alternatively, email editorial-team (at) simplywallst.com.
This article by Simply Wall St is general in nature. We provide commentary based on historical data and analyst forecasts only using an unbiased methodology and our articles are not intended to be financial advice. It does not constitute a recommendation to buy or sell any stock, and does not take account of your objectives, or your financial situation. We aim to bring you long-term focused analysis driven by fundamental data. Note that our analysis may not factor in the latest price-sensitive company announcements or qualitative material. Simply Wall St has no position in any stocks mentioned.