
Today we will run through one way of estimating the intrinsic value of Angelalign Technology Inc. (HKG:6699) by taking the expected future cash flows and discounting them to their present value. Our analysis will employ the Discounted Cash Flow (DCF) model. There's really not all that much to it, even though it might appear quite complex.
We would caution that there are many ways of valuing a company and, like the DCF, each technique has advantages and disadvantages in certain scenarios. For those who are keen learners of equity analysis, the Simply Wall St analysis model here may be something of interest to you.
View our latest analysis for Angelalign Technology
What's The Estimated Valuation?
We use what is known as a 2-stage model, which simply means we have two different periods of growth rates for the company's cash flows. Generally the first stage is higher growth, and the second stage is a lower growth phase. In the first stage we need to estimate the cash flows to the business over the next ten years. Where possible we use analyst estimates, but when these aren't available we extrapolate the previous free cash flow (FCF) from the last estimate or reported value. We assume companies with shrinking free cash flow will slow their rate of shrinkage, and that companies with growing free cash flow will see their growth rate slow, over this period. We do this to reflect that growth tends to slow more in the early years than it does in later years.
A DCF is all about the idea that a dollar in the future is less valuable than a dollar today, so we need to discount the sum of these future cash flows to arrive at a present value estimate:
10-year free cash flow (FCF) forecast
| 2023 | 2024 | 2025 | 2026 | 2027 | 2028 | 2029 | 2030 | 2031 | 2032 | |
| Levered FCF (CN¥, Millions) | CN¥392.4m | CN¥614.6m | CN¥875.5m | CN¥1.11b | CN¥1.29b | CN¥1.44b | CN¥1.56b | CN¥1.67b | CN¥1.75b | CN¥1.82b |
| Growth Rate Estimate Source | Analyst x5 | Analyst x5 | Analyst x2 | Analyst x2 | Est @ 15.91% | Est @ 11.61% | Est @ 8.59% | Est @ 6.48% | Est @ 5% | Est @ 3.96% |
| Present Value (CN¥, Millions) Discounted @ 6.0% | CN¥370 | CN¥547 | CN¥735 | CN¥882 | CN¥964 | CN¥1.0k | CN¥1.0k | CN¥1.0k | CN¥1.0k | CN¥1.0k |
("Est" = FCF growth rate estimated by Simply Wall St)
Present Value of 10-year Cash Flow (PVCF) = CN¥8.6b
After calculating the present value of future cash flows in the initial 10-year period, we need to calculate the Terminal Value, which accounts for all future cash flows beyond the first stage. The Gordon Growth formula is used to calculate Terminal Value at a future annual growth rate equal to the 5-year average of the 10-year government bond yield of 1.6%. We discount the terminal cash flows to today's value at a cost of equity of 6.0%.
Terminal Value (TV)= FCF2032 × (1 + g) ÷ (r – g) = CN¥1.8b× (1 + 1.6%) ÷ (6.0%– 1.6%) = CN¥41b
Present Value of Terminal Value (PVTV)= TV / (1 + r)10= CN¥41b÷ ( 1 + 6.0%)10= CN¥23b
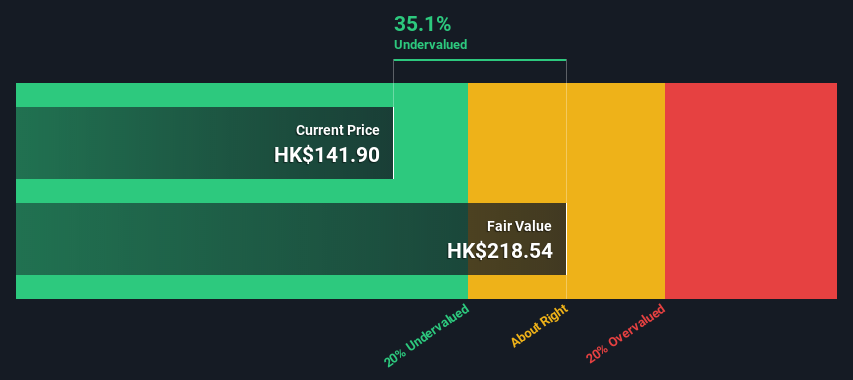
The total value, or equity value, is then the sum of the present value of the future cash flows, which in this case is CN¥32b. The last step is to then divide the equity value by the number of shares outstanding. Relative to the current share price of HK$142, the company appears quite undervalued at a 35% discount to where the stock price trades currently. Valuations are imprecise instruments though, rather like a telescope - move a few degrees and end up in a different galaxy. Do keep this in mind.
 SEHK:6699 Discounted Cash Flow August 1st 2022
Important Assumptions
Now the most important inputs to a discounted cash flow are the discount rate, and of course, the actual cash flows. If you don't agree with these result, have a go at the calculation yourself and play with the assumptions. The DCF also does not consider the possible cyclicality of an industry, or a company's future capital requirements, so it does not give a full picture of a company's potential performance. Given that we are looking at Angelalign Technology as potential shareholders, the cost of equity is used as the discount rate, rather than the cost of capital (or weighted average cost of capital, WACC) which accounts for debt. In this calculation we've used 6.0%, which is based on a levered beta of 0.904. Beta is a measure of a stock's volatility, compared to the market as a whole. We get our beta from the industry average beta of globally comparable companies, with an imposed limit between 0.8 and 2.0, which is a reasonable range for a stable business.
Looking Ahead:
Whilst important, the DCF calculation ideally won't be the sole piece of analysis you scrutinize for a company. The DCF model is not a perfect stock valuation tool. Preferably you'd apply different cases and assumptions and see how they would impact the company's valuation. If a company grows at a different rate, or if its cost of equity or risk free rate changes sharply, the output can look very different. Can we work out why the company is trading at a discount to intrinsic value? For Angelalign Technology, we've compiled three additional elements you should consider:
- Risks: Be aware that Angelalign Technology is showing 1 warning sign in our investment analysis , you should know about...
- Management:Have insiders been ramping up their shares to take advantage of the market's sentiment for 6699's future outlook? Check out our management and board analysis with insights on CEO compensation and governance factors.
- Other Solid Businesses: Low debt, high returns on equity and good past performance are fundamental to a strong business. Why not explore our interactive list of stocks with solid business fundamentals to see if there are other companies you may not have considered!
PS. The Simply Wall St app conducts a discounted cash flow valuation for every stock on the SEHK every day. If you want to find the calculation for other stocks just search here.
Have feedback on this article? Concerned about the content? Get in touch with us directly. Alternatively, email editorial-team (at) simplywallst.com.
This article by Simply Wall St is general in nature. We provide commentary based on historical data and analyst forecasts only using an unbiased methodology and our articles are not intended to be financial advice. It does not constitute a recommendation to buy or sell any stock, and does not take account of your objectives, or your financial situation. We aim to bring you long-term focused analysis driven by fundamental data. Note that our analysis may not factor in the latest price-sensitive company announcements or qualitative material. Simply Wall St has no position in any stocks mentioned.