
The external fund manager backed by Berkshire Hathaway's Charlie Munger, Li Lu, makes no bones about it when he says 'The biggest investment risk is not the volatility of prices, but whether you will suffer a permanent loss of capital.' When we think about how risky a company is, we always like to look at its use of debt, since debt overload can lead to ruin. Importantly, SATS Ltd. (SGX:S58) does carry debt. But the more important question is: how much risk is that debt creating?
When Is Debt Dangerous?
Generally speaking, debt only becomes a real problem when a company can't easily pay it off, either by raising capital or with its own cash flow. In the worst case scenario, a company can go bankrupt if it cannot pay its creditors. While that is not too common, we often do see indebted companies permanently diluting shareholders because lenders force them to raise capital at a distressed price. Of course, debt can be an important tool in businesses, particularly capital heavy businesses. When we examine debt levels, we first consider both cash and debt levels, together.
Check out our latest analysis for SATS
How Much Debt Does SATS Carry?
The image below, which you can click on for greater detail, shows that at June 2022 SATS had debt of S$820.3m, up from S$678.5m in one year. However, it also had S$765.1m in cash, and so its net debt is S$55.2m.
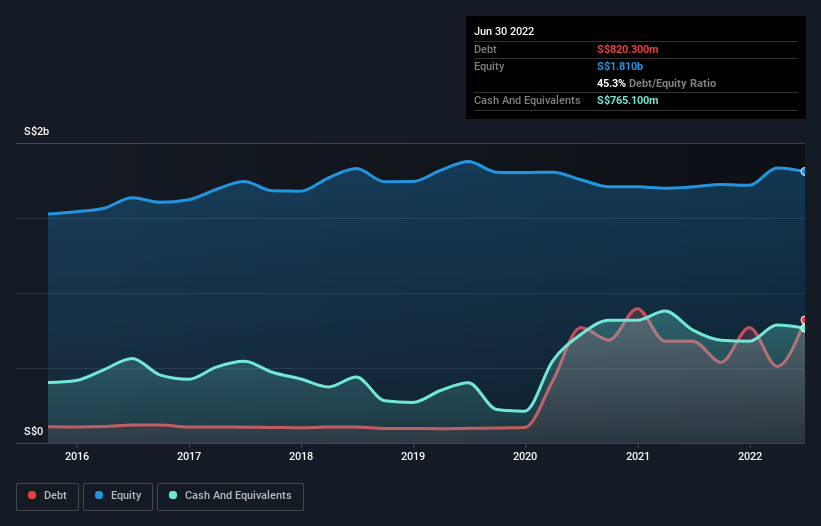 SGX:S58 Debt to Equity History July 27th 2022
A Look At SATS' Liabilities
Zooming in on the latest balance sheet data, we can see that SATS had liabilities of S$715.1m due within 12 months and liabilities of S$820.3m due beyond that. On the other hand, it had cash of S$765.1m and S$390.0m worth of receivables due within a year. So its liabilities outweigh the sum of its cash and (near-term) receivables by S$380.3m.
Of course, SATS has a market capitalization of S$4.42b, so these liabilities are probably manageable. Having said that, it's clear that we should continue to monitor its balance sheet, lest it change for the worse. Carrying virtually no net debt, SATS has a very light debt load indeed. When analysing debt levels, the balance sheet is the obvious place to start. But ultimately the future profitability of the business will decide if SATS can strengthen its balance sheet over time. So if you want to see what the professionals think, you might find this free report on analyst profit forecasts to be interesting.
In the last year SATS wasn't profitable at an EBIT level, but managed to grow its revenue by 23%, to S$1.3b. Shareholders probably have their fingers crossed that it can grow its way to profits.
Caveat Emptor
While we can certainly appreciate SATS's revenue growth, its earnings before interest and tax (EBIT) loss is not ideal. To be specific the EBIT loss came in at S$80m. When we look at that and recall the liabilities on its balance sheet, relative to cash, it seems unwise to us for the company to have any debt. So we think its balance sheet is a little strained, though not beyond repair. However, it doesn't help that it burned through S$53m of cash over the last year. So suffice it to say we do consider the stock to be risky. When we look at a riskier company, we like to check how their profits (or losses) are trending over time. Today, we're providing readers this interactive graph showing how SATS's profit, revenue, and operating cashflow have changed over the last few years.
If you're interested in investing in businesses that can grow profits without the burden of debt, then check out this free list of growing businesses that have net cash on the balance sheet.
Have feedback on this article? Concerned about the content? Get in touch with us directly. Alternatively, email editorial-team (at) simplywallst.com.
This article by Simply Wall St is general in nature. We provide commentary based on historical data and analyst forecasts only using an unbiased methodology and our articles are not intended to be financial advice. It does not constitute a recommendation to buy or sell any stock, and does not take account of your objectives, or your financial situation. We aim to bring you long-term focused analysis driven by fundamental data. Note that our analysis may not factor in the latest price-sensitive company announcements or qualitative material. Simply Wall St has no position in any stocks mentioned.