
For many investors, the main point of stock picking is to generate higher returns than the overall market. But in any portfolio, there are likely to be some stocks that fall short of that benchmark. We regret to report that long term China Oriental Group Company Limited (HKG:581) shareholders have had that experience, with the share price dropping 59% in three years, versus a market decline of about 2.3%. Shareholders have had an even rougher run lately, with the share price down 24% in the last 90 days.
After losing 6.3% this past week, it's worth investigating the company's fundamentals to see what we can infer from past performance.
View our latest analysis for China Oriental Group
There is no denying that markets are sometimes efficient, but prices do not always reflect underlying business performance. One flawed but reasonable way to assess how sentiment around a company has changed is to compare the earnings per share (EPS) with the share price.
During the three years that the share price fell, China Oriental Group's earnings per share (EPS) dropped by 20% each year. The share price decline of 26% is actually steeper than the EPS slippage. So it seems the market was too confident about the business, in the past. The less favorable sentiment is reflected in its current P/E ratio of 2.28.
You can see below how EPS has changed over time (discover the exact values by clicking on the image).
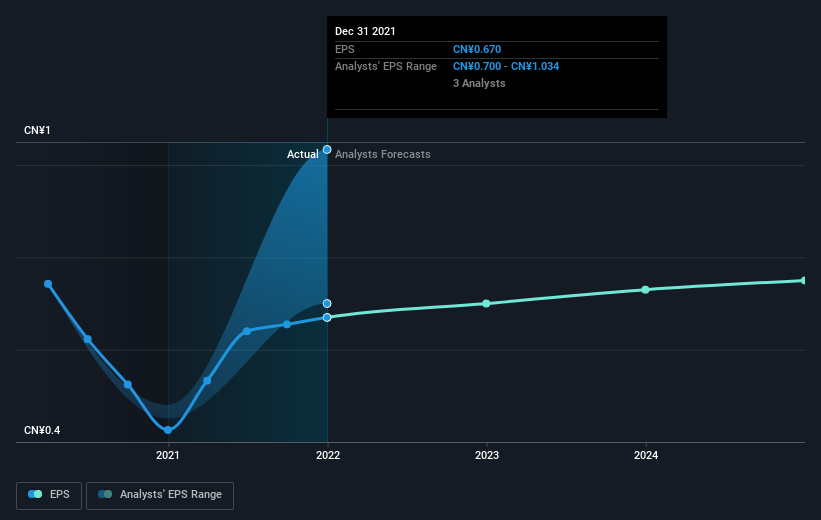 SEHK:581 Earnings Per Share Growth July 8th 2022
We know that China Oriental Group has improved its bottom line lately, but is it going to grow revenue? Check if analysts think China Oriental Group will grow revenue in the future.
What About Dividends?
It is important to consider the total shareholder return, as well as the share price return, for any given stock. Whereas the share price return only reflects the change in the share price, the TSR includes the value of dividends (assuming they were reinvested) and the benefit of any discounted capital raising or spin-off. Arguably, the TSR gives a more comprehensive picture of the return generated by a stock. In the case of China Oriental Group, it has a TSR of -46% for the last 3 years. That exceeds its share price return that we previously mentioned. And there's no prize for guessing that the dividend payments largely explain the divergence!
A Different Perspective
China Oriental Group shareholders are down 15% over twelve months (even including dividends), which isn't far from the market return of -16%. So last year was actually even worse than the last five years, which cost shareholders 6% per year. It will probably take a substantial improvement in the fundamental performance for the company to reverse this trend. It's always interesting to track share price performance over the longer term. But to understand China Oriental Group better, we need to consider many other factors. To that end, you should be aware of the 2 warning signs we've spotted with China Oriental Group .
Of course China Oriental Group may not be the best stock to buy. So you may wish to see this free collection of growth stocks.
Please note, the market returns quoted in this article reflect the market weighted average returns of stocks that currently trade on HK exchanges.
Have feedback on this article? Concerned about the content? Get in touch with us directly. Alternatively, email editorial-team (at) simplywallst.com.
This article by Simply Wall St is general in nature. We provide commentary based on historical data and analyst forecasts only using an unbiased methodology and our articles are not intended to be financial advice. It does not constitute a recommendation to buy or sell any stock, and does not take account of your objectives, or your financial situation. We aim to bring you long-term focused analysis driven by fundamental data. Note that our analysis may not factor in the latest price-sensitive company announcements or qualitative material. Simply Wall St has no position in any stocks mentioned.