
The main aim of stock picking is to find the market-beating stocks. But every investor is virtually certain to have both over-performing and under-performing stocks. So we wouldn't blame long term Shenzhen HeungKong Holding Co.,Ltd (SHSE:600162) shareholders for doubting their decision to hold, with the stock down 42% over a half decade. Furthermore, it's down 20% in about a quarter. That's not much fun for holders.
Given the past week has been tough on shareholders, let's investigate the fundamentals and see what we can learn.
View our latest analysis for Shenzhen HeungKong HoldingLtd
While the efficient markets hypothesis continues to be taught by some, it has been proven that markets are over-reactive dynamic systems, and investors are not always rational. One imperfect but simple way to consider how the market perception of a company has shifted is to compare the change in the earnings per share (EPS) with the share price movement.
During the five years over which the share price declined, Shenzhen HeungKong HoldingLtd's earnings per share (EPS) dropped by 24% each year. This fall in the EPS is worse than the 10% compound annual share price fall. The relatively muted share price reaction might be because the market expects the business to turn around.
The company's earnings per share (over time) is depicted in the image below (click to see the exact numbers).
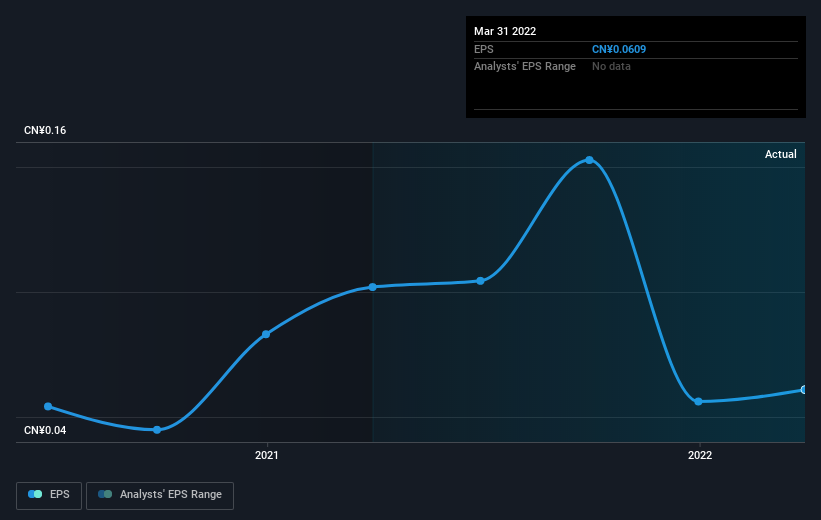 SHSE:600162 Earnings Per Share Growth July 7th 2022
This free interactive report on Shenzhen HeungKong HoldingLtd's earnings, revenue and cash flow is a great place to start, if you want to investigate the stock further.
What About Dividends?
It is important to consider the total shareholder return, as well as the share price return, for any given stock. Whereas the share price return only reflects the change in the share price, the TSR includes the value of dividends (assuming they were reinvested) and the benefit of any discounted capital raising or spin-off. So for companies that pay a generous dividend, the TSR is often a lot higher than the share price return. In the case of Shenzhen HeungKong HoldingLtd, it has a TSR of -33% for the last 5 years. That exceeds its share price return that we previously mentioned. This is largely a result of its dividend payments!
A Different Perspective
It's nice to see that Shenzhen HeungKong HoldingLtd shareholders have received a total shareholder return of 14% over the last year. And that does include the dividend. There's no doubt those recent returns are much better than the TSR loss of 6% per year over five years. The long term loss makes us cautious, but the short term TSR gain certainly hints at a brighter future. It's always interesting to track share price performance over the longer term. But to understand Shenzhen HeungKong HoldingLtd better, we need to consider many other factors. Like risks, for instance. Every company has them, and we've spotted 5 warning signs for Shenzhen HeungKong HoldingLtd (of which 2 shouldn't be ignored!) you should know about.
If you would prefer to check out another company -- one with potentially superior financials -- then do not miss this free list of companies that have proven they can grow earnings.
Please note, the market returns quoted in this article reflect the market weighted average returns of stocks that currently trade on CN exchanges.
Have feedback on this article? Concerned about the content? Get in touch with us directly. Alternatively, email editorial-team (at) simplywallst.com.
This article by Simply Wall St is general in nature. We provide commentary based on historical data and analyst forecasts only using an unbiased methodology and our articles are not intended to be financial advice. It does not constitute a recommendation to buy or sell any stock, and does not take account of your objectives, or your financial situation. We aim to bring you long-term focused analysis driven by fundamental data. Note that our analysis may not factor in the latest price-sensitive company announcements or qualitative material. Simply Wall St has no position in any stocks mentioned.