For many investors, the main point of stock picking is to generate higher returns than the overall market. But if you try your hand at stock picking, your risk returning less than the market. Unfortunately, that's been the case for longer term Guangdong Investment Limited (HKG:270) shareholders, since the share price is down 56% in the last three years, falling well short of the market decline of around 4.3%. The more recent news is of little comfort, with the share price down 32% in a year. Furthermore, it's down 23% in about a quarter. That's not much fun for holders. But this could be related to the weak market, which is down 16% in the same period.
It's worthwhile assessing if the company's economics have been moving in lockstep with these underwhelming shareholder returns, or if there is some disparity between the two. So let's do just that.
See our latest analysis for Guangdong Investment
There is no denying that markets are sometimes efficient, but prices do not always reflect underlying business performance. One imperfect but simple way to consider how the market perception of a company has shifted is to compare the change in the earnings per share (EPS) with the share price movement.
Guangdong Investment saw its EPS decline at a compound rate of 1.1% per year, over the last three years. This reduction in EPS is slower than the 24% annual reduction in the share price. So it's likely that the EPS decline has disappointed the market, leaving investors hesitant to buy. This increased caution is also evident in the rather low P/E ratio, which is sitting at 9.14.
The image below shows how EPS has tracked over time (if you click on the image you can see greater detail).
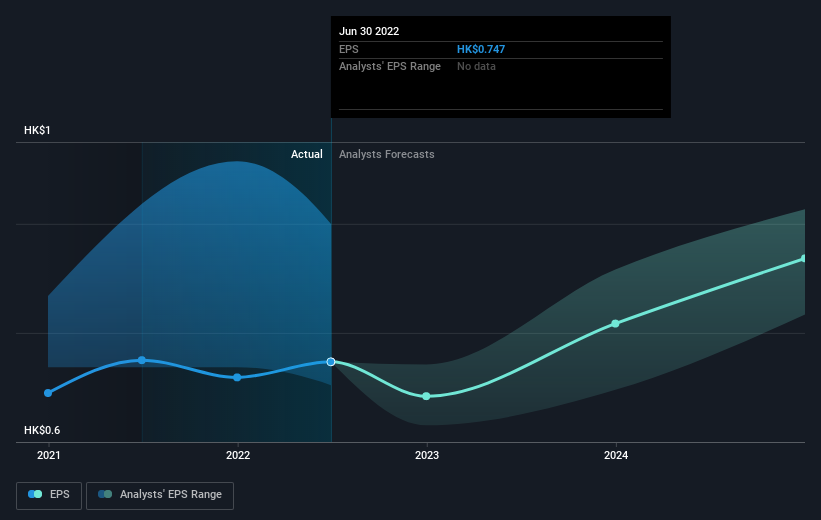
SEHK:270 Earnings Per Share Growth September 25th 2022
Before buying or selling a stock, we always recommend a close examination of historic growth trends, available here.
What About Dividends?
When looking at investment returns, it is important to consider the difference between total shareholder return (TSR) and share price return. The TSR is a return calculation that accounts for the value of cash dividends (assuming that any dividend received was reinvested) and the calculated value of any discounted capital raisings and spin-offs. So for companies that pay a generous dividend, the TSR is often a lot higher than the share price return. In the case of Guangdong Investment, it has a TSR of -48% for the last 3 years. That exceeds its share price return that we previously mentioned. The dividends paid by the company have thusly boosted the total shareholder return.
A Different Perspective
While the broader market lost about 22% in the twelve months, Guangdong Investment shareholders did even worse, losing 28% (even including dividends). However, it could simply be that the share price has been impacted by broader market jitters. It might be worth keeping an eye on the fundamentals, in case there's a good opportunity. Unfortunately, last year's performance may indicate unresolved challenges, given that it was worse than the annualised loss of 4% over the last half decade. Generally speaking long term share price weakness can be a bad sign, though contrarian investors might want to research the stock in hope of a turnaround. It's always interesting to track share price performance over the longer term. But to understand Guangdong Investment better, we need to consider many other factors. Even so, be aware that Guangdong Investment is showing 1 warning sign in our investment analysis , you should know about...
Of course, you might find a fantastic investment by looking elsewhere. So take a peek at this free list of companies we expect will grow earnings.
Please note, the market returns quoted in this article reflect the market weighted average returns of stocks that currently trade on HK exchanges.
Have feedback on this article? Concerned about the content? Get in touch with us directly. Alternatively, email editorial-team (at) simplywallst.com.
This article by Simply Wall St is general in nature. We provide commentary based on historical data and analyst forecasts only using an unbiased methodology and our articles are not intended to be financial advice. It does not constitute a recommendation to buy or sell any stock, and does not take account of your objectives, or your financial situation. We aim to bring you long-term focused analysis driven by fundamental data. Note that our analysis may not factor in the latest price-sensitive company announcements or qualitative material. Simply Wall St has no position in any stocks mentioned.
多くの投資家にとって、株式選択の主眼は、全体市場よりも高いリターンを生み出すことである。しかし株を選んでみるとリスクリターンは市場よりも低くなります残念ながら長期的にはこのような状況です広東海投資有限公司(HKG:270)株主は、株価が過去3年間で56%下落したため、約4.3%の市場下落幅をはるかに下回った。最近のニュースは喜ばしいことではなく、同社の株価は1年で32%下落した。しかも、それは約4分の1の間に23%減少した。所有者にとって、これはあまり楽しいことではない。しかし、これは疲弊した市場と関連があるかもしれず、同期市場は16%下落した
評価に値するのは、同社の経済状況がこれらの平凡な株主リターンと同期しているかどうか、あるいは両者の間にいくつかの差があるかどうかである。だからそうしましょう
広東海への投資の最新分析を参照してください
市場が時々有効であることは否定できないが、価格は常に潜在的な商業表現を反映しているわけではない。1社に対する市場の見方がどのように変化しているかを考える不完全で簡単な方法は、1株当たり収益(EPS)の変化を株価動向と比較することである
過去3年間、広東海投資の1株当たり収益は毎年1.1%の複合速度で低下した。1株当たりの収益のこの低下速度は、同社の株価の年間24%の下げ幅よりも遅い。そのため、1株当たりの収益の低下が市場を失望させ、投資家に購入をためらわせている可能性が高い。このようなより慎重な態度も明らかにかなり低い市益率に現れており,現在は9.14倍である
次の図は,EPSがどのように時間とともに追跡されているかを示している(この画像をクリックすると,より詳細な情報が見られる)
連結所:270株当たり利益増加2022年9月25日
株を売買する前に、私たちはいつも歴史的な増加傾向をよく検討して、ここで見つけることをお勧めします
配当金は?
投資リターンを考察する際には,重要なのは株主総リターン(TSR)と株価リターンそれは.TSRは,現金配当金の価値(受け取った任意の配当金が再投資されたと仮定する)と,任意の割引融資と剥離の計算価値を計上したリターン計算である。したがって、手厚い配当金を支払う会社にとって、TSRは株価リターンよりもはるかに高いことが多い。広東海投資を例にとると、過去3年間の総資産収益率は-48%だった。これは私たちが前に言及したその株価収益を超えている。その会社が支払った配当金が活性化した合計する株主に見返りを与える
異なる視点
大盤は過去12カ月で約22%損失したが、広東海投資株主の表現はさらに悪く、28%(配当も含む)損失した。しかし、これは株価がより広い市場緊張感の影響を受けているだけかもしれない。機会が発生しないように基本的な面に集中する必要があるかもしれない。不幸にも、昨年の表現は過去5年間の年化損失の4%よりも悪いため、未解決の挑戦を暗示するかもしれない。一般的に、株価の長期的な疲弊は悪い信号かもしれませんが、逆投資家はこの株を研究したいかもしれませんが、好転してほしいです。株価を追跡する長期的な表現はいつも面白い。しかし、広東海投資をよりよく理解するためには、私たちはまた多くの他の要素を考慮する必要がある。それでも広東海への投資が展示されています私たちの投資分析では1つの警告信号が現れましたあなたは…について知っているはずです
もちろん他のところに目を向けると、これが素晴らしい投資だと気づくかもしれません。これを見てみましょう無料です私たちは収益が増加する会社のリストを予想している
本稿で引用した市場リターンは、現在香港取引所で取引されている株式の市場加重平均リターンを反映していることに注意されたい。
この文章に何かフィードバックはありますか。内容が心配ですか。 連絡を取り合う私たちに直接連絡します。あるいは,編集グループに電子メールを送信することも可能であり,アドレスはimplywallst.comである.
本稿ではSimply Wall St.によって作成され,包括的である私たちは歴史データとアナリスト予測に基づくコメントを偏りのない方法で提供するだけで、私たちの文章は財務アドバイスとしてのつもりはありません。それは株を売買する提案にもなりませんし、あなたの目標やあなたの財務状況も考慮していません。私たちの目標はあなたにファンダメンタルデータによって駆動される長期的な重点分析をもたらすことです。私たちの分析は最新の価格に敏感な会社の公告や定性材料を考慮しないかもしれないことに注意してください。Simply Wall St.上記のいずれの株に対しても在庫を持っていない.