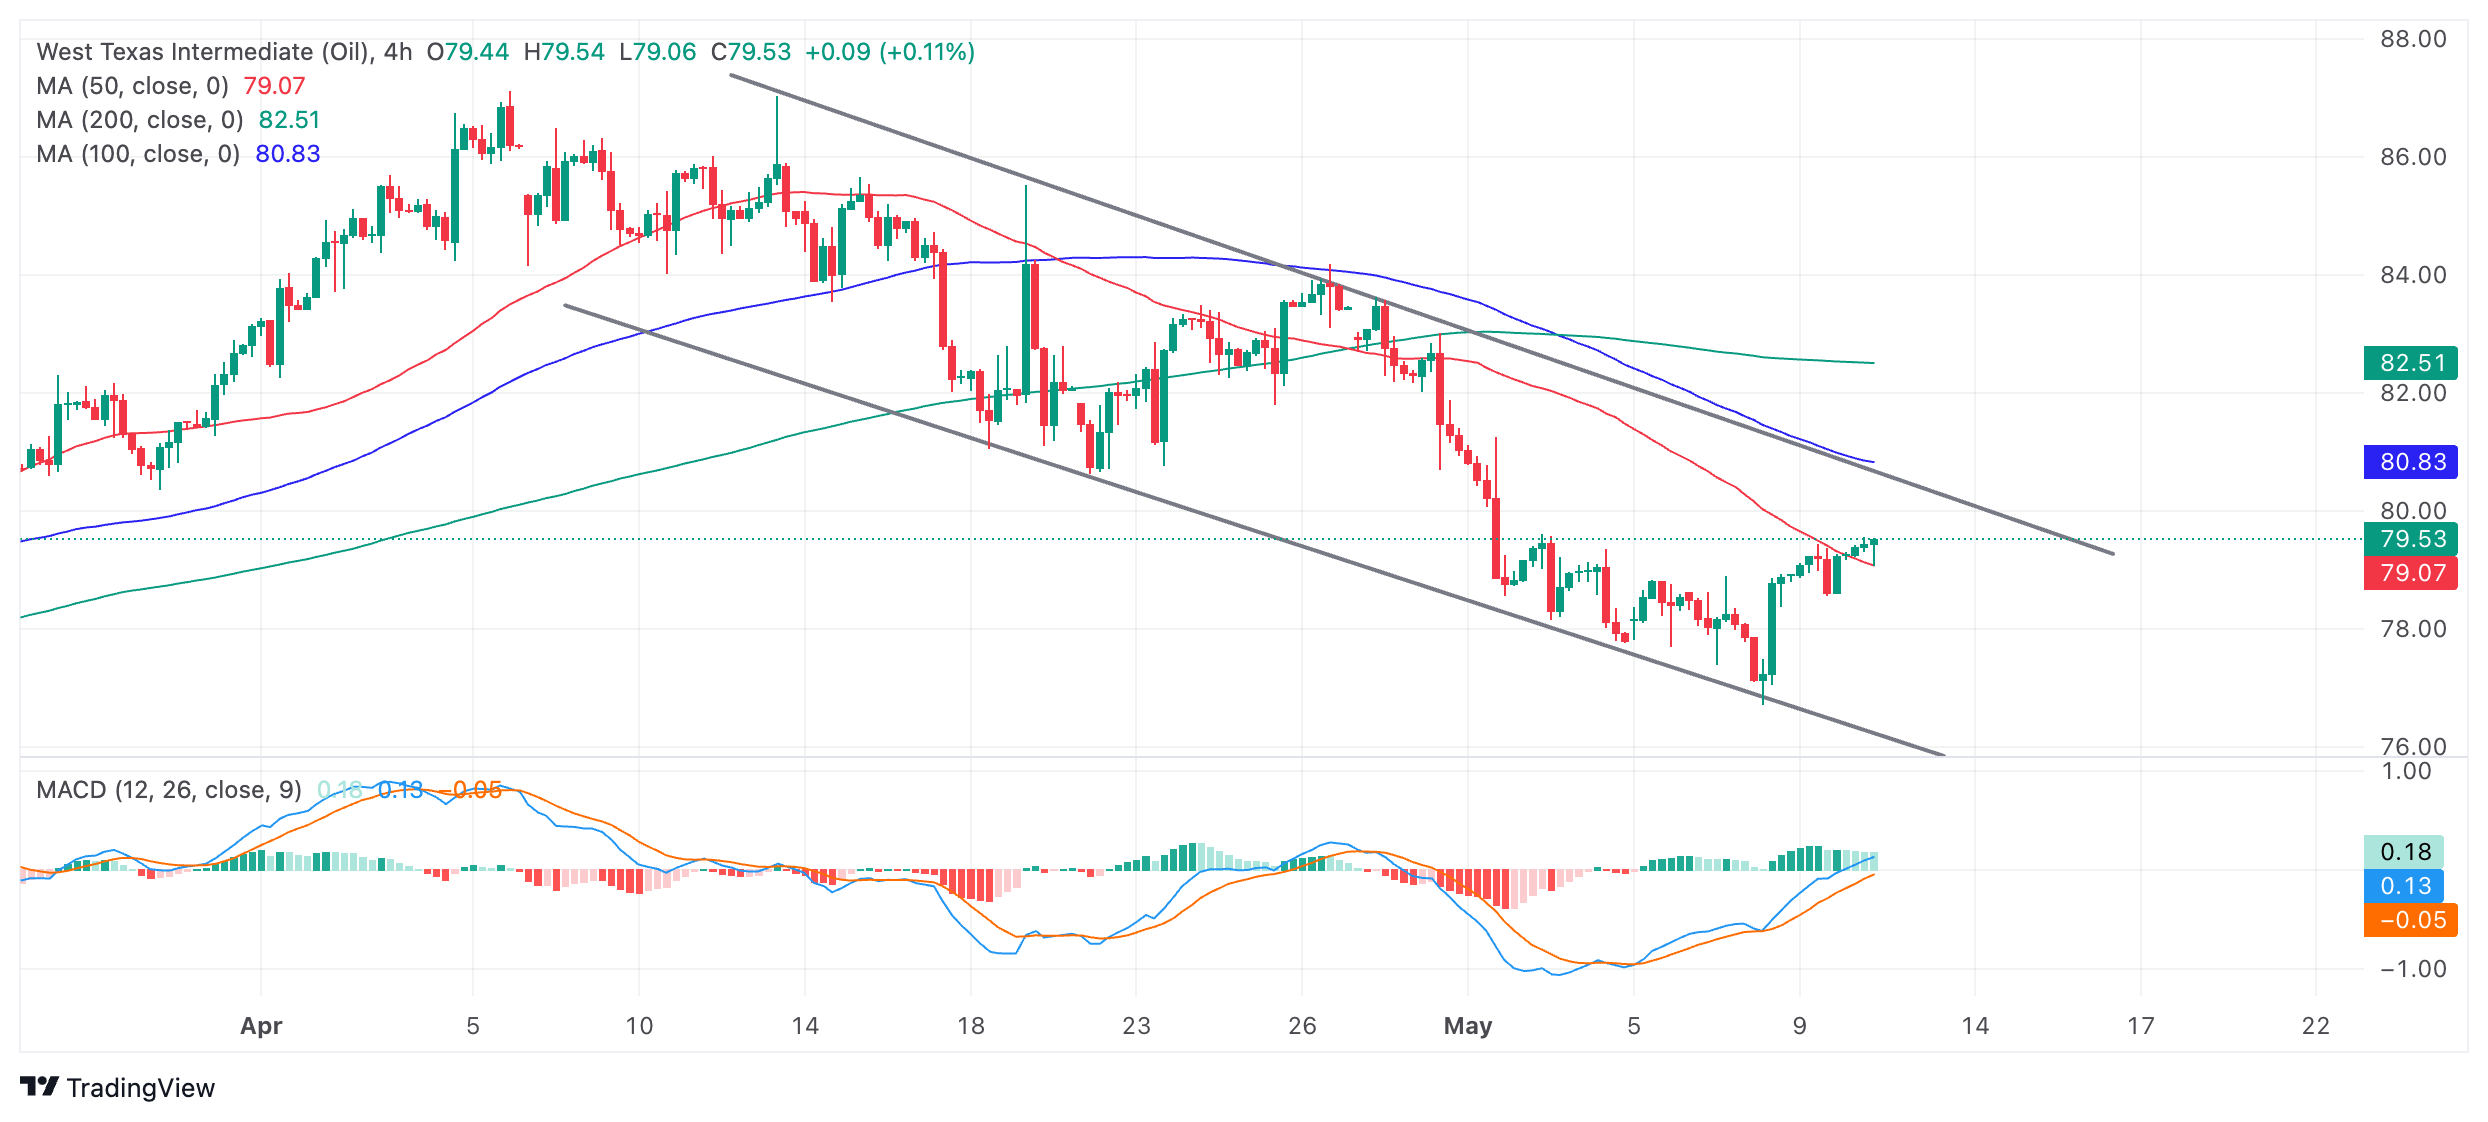
- Oil is falling in a descending channel on the short-term horizon.
- Within the channel it is currently correcting higher, however, it is likely to capitulate and resume its downtrend.
- Only a decisive break out of the channel would reverse the short-term bearish outlook.
Oil price is trading higher, exchanging hands in the 79.50s at the time of writing on Friday, as it rises up within a falling channel.
West Texas Intermediate (WTI) Crude Oil is in a short-term downtrend which, given the old adage “the trend is your friend,” is expected to eventually continue once the current correction has finished.
US WTI Oil 4-hour Chart
WTI Oil will probably continue rising first, however, given there are no signs yet that the correction is running out of steam. The price might well reach the upper channel line at around $80.00, however, when it gets there it will almost certainly meet tough resistance, and probably reverse lower.
Oil has broken above the 50 Simple Moving Average (SMA) – a bullish sign – but it has not yet broken above the 100 or 200 SMAs. Oil price would have to decisively break out of the falling channel and the 100 SMA to mark a change of trend and suggest a more bullish technical outlook.
A decisive break would be one accompanied by a long green candle that closed near its high or three green candles in a row that broke above the channel line.
Such a break, if it were to happen, could see Oil rally to an initial target at roughly $83.10, the Fibonacci 0.681 ratio of the height of the channel extrapolated higher.
The Moving Average Convergence Divergence (MACD) momentum indicator has risen above the zero-line and is painting green histogram bars suggesting the current up leg is likely to extend. Resistance from the channel line, however, will probably eventually push price back down. The overall bear trend suggests the possibility of Oil falling back down to $76.00 lows eventually.
Information on these pages contains forward-looking statements that involve risks and uncertainties. Markets and instruments profiled on this page are for informational purposes only and should not in any way come across as a recommendation to buy or sell in these assets. You should do your own thorough research before making any investment decisions. FXStreet does not in any way guarantee that this information is free from mistakes, errors, or material misstatements. It also does not guarantee that this information is of a timely nature. Investing in Open Markets involves a great deal of risk, including the loss of all or a portion of your investment, as well as emotional distress. All risks, losses and costs associated with investing, including total loss of principal, are your responsibility. The views and opinions expressed in this article are those of the authors and do not necessarily reflect the official policy or position of FXStreet nor its advertisers. The author will not be held responsible for information that is found at the end of links posted on this page.
If not otherwise explicitly mentioned in the body of the article, at the time of writing, the author has no position in any stock mentioned in this article and no business relationship with any company mentioned. The author has not received compensation for writing this article, other than from FXStreet.
FXStreet and the author do not provide personalized recommendations. The author makes no representations as to the accuracy, completeness, or suitability of this information. FXStreet and the author will not be liable for any errors, omissions or any losses, injuries or damages arising from this information and its display or use. Errors and omissions excepted.
The author and FXStreet are not registered investment advisors and nothing in this article is intended to be investment advice.
Recommended content
Editors’ Picks
EUR/USD stands tall near its highest level since March, just above 1.0900 mark

EUR/USD advances to its highest level since March in the wake of a modest USD downtick. Monday’s disappointing US ISM PMI reaffirms Fed rate cut bets and undermines the buck. Bulls, however, prefer to wait for the ECB meeting on Thursday before placing fresh bets.
GBP/USD bulls have the upper hand above 1.2800, highest since March

GBP/USD struggles to capitalize on the move to a nearly three-month high set this Tuesday. Fed rate cut bets keep the USD bulls on the defensive and lend some support to the major. The technical setup validates the positive outlook and supports prospects for further gains.
Gold awaits US employment data for the range breakout

Gold price is facing a modest selling pressure near $2,355 in Asian trading on Tuesday, pausing its solid rebound staged a day ago. Gold price eagerly awaits the US employment data trickling in this week, starting with the JOLTS Job Openings later on Tuesday, for a fresh directional impetus.
Signs are showing ETC correction may be over

Ethereum Classic crashed 18% between May 23 and June 3, heading towards its major support area of $28.53 and $26.67. A correction to this area could be a buying opportunity for investors before the second leg higher.
Seven fundamentals for the week: Two rate cuts, Nonfarm Payrolls to jolt markets in a packed week Premium

May's end-of-month flows were wild but directionless – and the first week of June is packed of top-tier events that may shape trends for weeks. Forward-looking surveys, guidance about the next moves from central banks and all-important US job figures are all on the docket.
