
 Yahoo Finance
 Institutions own 37% of CapitaLand India Trust (SGX:CY6U) shares but individual investors control 45% of the company
Key Insights
The considerable ownership by individual investors in CapitaLand India Trust indicates that they collectively have a greater say in management and business strategy
A total of 16 investors have a majority stake in the company with 50% ownership
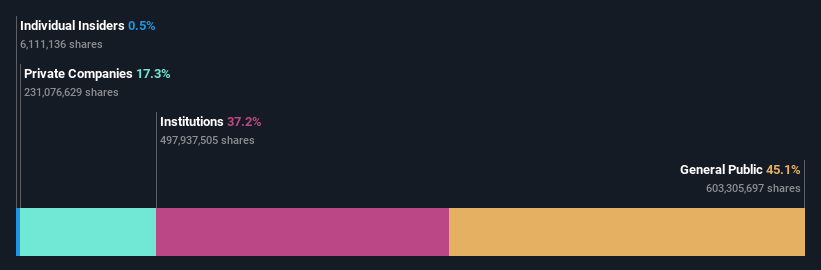
A look at the shareholders of CapitaLand India Trust (SGX:CY6U) can tell us which group is most powerful. With 45% stake, individual investors possess the maximum shares in the company. That is, the group stands to benefit the most if the stock rises (or lose the most if there is a downturn).
Institutions, on the other hand, account for 37% of the company's stockholders. Insiders often own a large chunk of younger, smaller, companies while huge companies tend to have institutions as shareholders.
Let's take a closer look to see what the different types of shareholders can tell us about CapitaLand India Trust.
View our latest analysis for CapitaLand India Trust
What Does The Institutional Ownership Tell Us About CapitaLand India Trust?
Institutional investors commonly compare their own returns to the returns of a commonly followed index. So they generally do consider buying larger companies that are included in the relevant benchmark index.
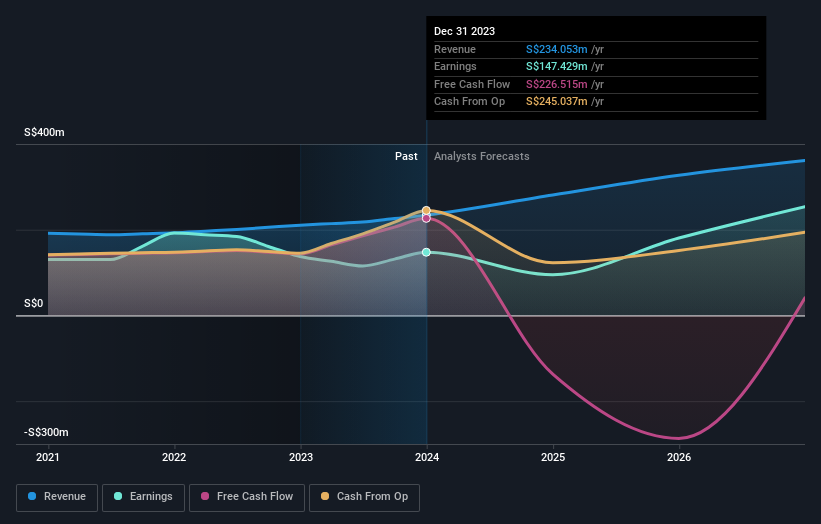
We can see that CapitaLand India Trust does have institutional investors; and they hold a good portion of the company's stock. This can indicate that the company has a certain degree of credibility in the investment community. However, it is best to be wary of relying on the supposed validation that comes with institutional investors. They too, get it wrong sometimes. It is not uncommon to see a big share price drop if two large institutional investors try to sell out of a stock at the same time. So it is worth checking the past earnings trajectory of CapitaLand India Trust, (below). Of course, keep in mind that there are other factors to consider, too.
We note that hedge funds don't have a meaningful investment in CapitaLand India Trust. Bartley Investments Pte. Ltd. is currently the largest shareholder, with 17% of shares outstanding. With 7.0% and 4.3% of the shares outstanding respectively, Ascendas Property Fund Trustee Pte Ltd and Kabouter Management, LLC are the second and third largest shareholders.
A closer look at our ownership figures suggests that the top 16 shareholders have a combined ownership of 50% implying that no single shareholder has a majority.
Researching institutional ownership is a good way to gauge and filter a stock's expected performance. The same can be achieved by studying analyst sentiments. There are plenty of analysts covering the stock, so it might be worth seeing what they are forecasting, too.
Insider Ownership Of CapitaLand India Trust
The definition of company insiders can be subjective and does vary between jurisdictions. Our data reflects individual insiders, capturing board members at the very least. Management ultimately answers to the board. However, it is not uncommon for managers to be executive board members, especially if they are a founder or the CEO.
Insider ownership is positive when it signals leadership are thinking like the true owners of the company. However, high insider ownership can also give immense power to a small group within the company. This can be negative in some circumstances.
Our most recent data indicates that insiders own less than 1% of CapitaLand India Trust. However, it's possible that insiders might have an indirect interest through a more complex structure. It is a pretty big company, so it would be possible for board members to own a meaningful interest in the company, without owning much of a proportional interest. In this case, they own around S$6.3m worth of shares (at current prices). It is good to see board members owning shares, but it might be worth checking if those insiders have been buying.
General Public Ownership
The general public-- including retail investors -- own 45% stake in the company, and hence can't easily be ignored. This size of ownership, while considerable, may not be enough to change company policy if the decision is not in sync with other large shareholders.
Private Company Ownership
Our data indicates that Private Companies hold 17%, of the company's shares. It's hard to draw any conclusions from this fact alone, so its worth looking into who owns those private companies. Sometimes insiders or other related parties have an interest in shares in a public company through a separate private company.
Next Steps:
It's always worth thinking about the different groups who own shares in a company. But to understand CapitaLand India Trust better, we need to consider many other factors. To that end, you should learn about the 4 warning signs we've spotted with CapitaLand India Trust (including 1 which is concerning) .
If you would prefer discover what analysts are predicting in terms of future growth, do not miss this free report on analyst forecasts.
NB: Figures in this article are calculated using data from the last twelve months, which refer to the 12-month period ending on the last date of the month the financial statement is dated. This may not be consistent with full year annual report figures.
Have feedback on this article? Concerned about the content? Get in touch with us directly. Alternatively, email editorial-team (at) simplywallst.com.
This article by Simply Wall St is general in nature. We provide commentary based on historical data and analyst forecasts only using an unbiased methodology and our articles are not intended to be financial advice. It does not constitute a recommendation to buy or sell any stock, and does not take account of your objectives, or your financial situation. We aim to bring you long-term focused analysis driven by fundamental data. Note that our analysis may not factor in the latest price-sensitive company announcements or qualitative material. Simply Wall St has no position in any stocks mentioned.
