
-
市場
-
產品
-
資訊
-
Moo社區
-
課堂
-
查看更多
-
功能介紹
-
費用費用透明,無最低余額限制
投資選擇、功能介紹、費用相關信息由Moomoo Financial Inc.提供
- English
- 中文繁體
- 中文简体
- 深色
- 淺色
Investing in HKT Trust and HKT (HKG:6823) Three Years Ago Would Have Delivered You a 1.9% Gain
Investing in HKT Trust and HKT (HKG:6823) Three Years Ago Would Have Delivered You a 1.9% Gain
No-one enjoys it when they lose money on a stock. But no-one can make money on every call, especially in a declining market. While the HKT Trust and HKT Limited (HKG:6823) share price is down 16% in the last three years, the total return to shareholders (which includes dividends) was 1.9%. And that total return actually beats the market decline of 4.1%.
It's worthwhile assessing if the company's economics have been moving in lockstep with these underwhelming shareholder returns, or if there is some disparity between the two. So let's do just that.
Check out our latest analysis for HKT Trust and HKT
In his essay The Superinvestors of Graham-and-Doddsville Warren Buffett described how share prices do not always rationally reflect the value of a business. By comparing earnings per share (EPS) and share price changes over time, we can get a feel for how investor attitudes to a company have morphed over time.
HKT Trust and HKT saw its EPS decline at a compound rate of 2.0% per year, over the last three years. The share price decline of 6% is actually steeper than the EPS slippage. So it's likely that the EPS decline has disappointed the market, leaving investors hesitant to buy.
The graphic below depicts how EPS has changed over time (unveil the exact values by clicking on the image).
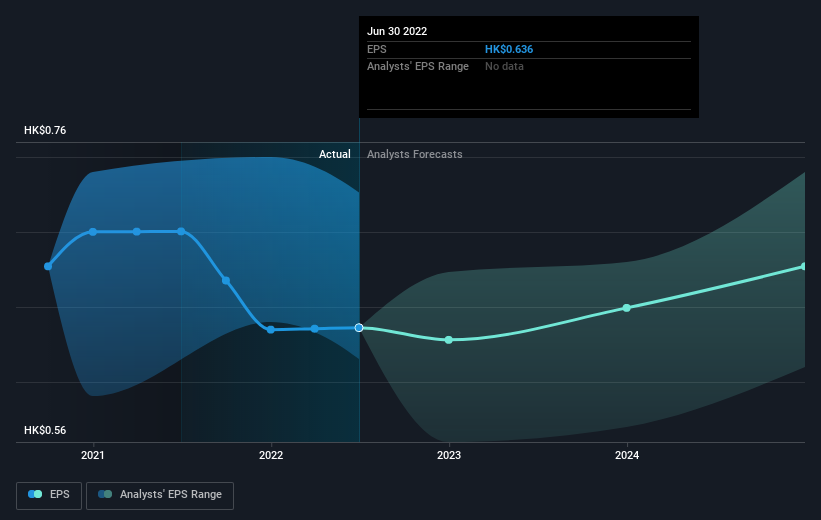 SEHK:6823 Earnings Per Share Growth December 8th 2022
Dive deeper into HKT Trust and HKT's key metrics by checking this interactive graph of HKT Trust and HKT's earnings, revenue and cash flow.
What About Dividends?
It is important to consider the total shareholder return, as well as the share price return, for any given stock. The TSR incorporates the value of any spin-offs or discounted capital raisings, along with any dividends, based on the assumption that the dividends are reinvested. It's fair to say that the TSR gives a more complete picture for stocks that pay a dividend. We note that for HKT Trust and HKT the TSR over the last 3 years was 1.9%, which is better than the share price return mentioned above. This is largely a result of its dividend payments!
A Different Perspective
While it's never nice to take a loss, HKT Trust and HKT shareholders can take comfort that , including dividends,their trailing twelve month loss of 4.4% wasn't as bad as the market loss of around 18%. Of course, the long term returns are far more important and the good news is that over five years, the stock has returned 6% for each year. In the best case scenario the last year is just a temporary blip on the journey to a brighter future. It's always interesting to track share price performance over the longer term. But to understand HKT Trust and HKT better, we need to consider many other factors. To that end, you should learn about the 2 warning signs we've spotted with HKT Trust and HKT (including 1 which is potentially serious) .
But note: HKT Trust and HKT may not be the best stock to buy. So take a peek at this free list of interesting companies with past earnings growth (and further growth forecast).
Please note, the market returns quoted in this article reflect the market weighted average returns of stocks that currently trade on HK exchanges.
Have feedback on this article? Concerned about the content? Get in touch with us directly. Alternatively, email editorial-team (at) simplywallst.com.
This article by Simply Wall St is general in nature. We provide commentary based on historical data and analyst forecasts only using an unbiased methodology and our articles are not intended to be financial advice. It does not constitute a recommendation to buy or sell any stock, and does not take account of your objectives, or your financial situation. We aim to bring you long-term focused analysis driven by fundamental data. Note that our analysis may not factor in the latest price-sensitive company announcements or qualitative material. Simply Wall St has no position in any stocks mentioned.
當他們在一隻股票上賠錢時,沒有人喜歡它。但沒有人能在每一通電話上都賺錢,特別是在市場下跌的情況下。而當香港電訊-SS有限公司(HKG:6823)過去三年股價下跌16%,股東總回報(包括股息)為1.9%。這一總回報率實際上超過了4.1%的市場跌幅。
值得評估的是,該公司的經濟狀況是否一直與這些平淡無奇的股東回報同步,或者兩者之間是否存在一些差距。所以我們就這麼做吧。
看看我們對香港電訊-SS的最新分析
在他的文章中格雷厄姆和多德斯維爾的超級投資者沃倫·巴菲特描述了股價並不總是理性地反映一家企業的價值。通過比較每股收益(EPS)和股價隨時間的變化,我們可以感受到投資者對一家公司的態度隨著時間的推移發生了怎樣的變化。
過去三年,香港電訊-SS的每股收益以每年2.0%的復合速度下降。6%的股價跌幅實際上比每股收益下滑幅度更大。因此,很可能是每股收益的下降令市場失望,讓投資者對買入猶豫不決。
下圖描述了EPS是如何隨著時間的推移而變化的(通過單擊圖像來揭示確切的值)。
聯交所:6823每股盈利增長2022年12月8日通過查看這張香港電訊-SS的收益、收入和現金流的互動圖表,更深入地研究香港電訊-SS的關鍵指標。
那股息呢?
重要的是要考慮任何給定股票的總股東回報以及股價回報。TSR包括任何剝離或貼現融資的價值,以及任何股息,基於股息再投資的假設。公平地說,TSR為支付股息的股票提供了更完整的圖景。我們注意到,香港電訊-SS過去3年的總回報率為1.9%,好於上面提到的股價回報率。這在很大程度上是其股息支付的結果!
不同的視角
雖然虧損從來都不是好事,但香港電訊-SS的股東們可以感到欣慰的是,包括股息在內,他們過去12個月的4.4%的虧損沒有市場上18%左右的虧損那麼糟糕。當然,長期回報要重要得多,好消息是,在過去的五年裡,該股的年回報率為6%。在最好的情況下,去年只是通向更光明未來的旅途中的一個暫時的轉捩點。跟蹤股價的長期表現總是很有趣的。但要更好地理解香港電訊-SS,我們還需要考慮許多其他因素。為此,您應該瞭解2個警告標誌我們已經發現了香港電訊-SS(包括1名潛在的嚴重威脅)。
但請注意:香港電訊-SS可能不是最值得買入的股票。所以讓我們來看看這個免費過去有盈利增長(以及進一步增長預測)的有趣公司名單。
請注意,本文引用的市場回報反映了目前在香港交易所交易的股票的市場加權平均回報。
對這篇文章有什麼反饋嗎?擔心內容嗎? 保持聯繫直接與我們聯繫。或者,也可以給編輯組發電子郵件,地址是implywallst.com。
本文由Simply Wall St.撰寫,具有概括性。我們僅使用不偏不倚的方法提供基於歷史數據和分析師預測的評論,我們的文章並不打算作為財務建議。它不構成買賣任何股票的建議,也沒有考慮你的目標或你的財務狀況。我們的目標是為您帶來由基本面數據驅動的長期重點分析。請注意,我們的分析可能不會將最新的對價格敏感的公司公告或定性材料考慮在內。Simply Wall St.對上述任何一隻股票都沒有持倉。
moomoo是Moomoo Technologies Inc.公司提供的金融資訊和交易應用程式。
在美國,moomoo上的投資產品和服務由Moomoo Financial Inc.提供,一家受美國證券交易委員會(SEC)監管的持牌主體。 Moomoo Financial Inc.是金融業監管局(FINRA)和證券投資者保護公司(SIPC)的成員。
在新加坡,moomoo上的投資產品和服務是通過Moomoo Financial Singapore Pte. Ltd.提供,該公司受新加坡金融管理局(MAS)監管(牌照號碼︰CMS101000) ,持有資本市場服務牌照 (CMS) ,持有財務顧問豁免(Exempt Financial Adviser)資質。本內容未經新加坡金融管理局的審查。
在澳大利亞,moomoo上的金融產品和服務是通過Futu Securities (Australia) Ltd提供,該公司是受澳大利亞證券和投資委員會(ASIC)監管的澳大利亞金融服務許可機構(AFSL No. 224663)。請閱讀並理解我們的《金融服務指南》、《條款與條件》、《隱私政策》和其他披露文件,這些文件可在我們的網站 https://www.moomoo.com/au中獲取。
在加拿大,透過moomoo應用程式提供的僅限訂單執行的券商服務由Moomoo Financial Canada Inc.提供,並受加拿大投資監管機構(CIRO)監管。
在馬來西亞,moomoo上的投資產品和服務是透過Moomoo Securities Malaysia Sdn. Bhd. 提供,該公司受馬來西亞證券監督委員會(SC)監管(牌照號碼︰eCMSL/A0397/2024) ,持有資本市場服務牌照 (CMSL) 。本內容未經馬來西亞證券監督委員會的審查。
Moomoo Technologies Inc., Moomoo Financial Inc., Moomoo Financial Singapore Pte. Ltd.,Futu Securities (Australia) Ltd, Moomoo Financial Canada Inc和Moomoo Securities Malaysia Sdn. Bhd., 是關聯公司。
風險及免責聲明
moomoo是Moomoo Technologies Inc.公司提供的金融資訊和交易應用程式。
在美國,moomoo上的投資產品和服務由Moomoo Financial Inc.提供,一家受美國證券交易委員會(SEC)監管的持牌主體。 Moomoo Financial Inc.是金融業監管局(FINRA)和證券投資者保護公司(SIPC)的成員。
在新加坡,moomoo上的投資產品和服務是通過Moomoo Financial Singapore Pte. Ltd.提供,該公司受新加坡金融管理局(MAS)監管(牌照號碼︰CMS101000) ,持有資本市場服務牌照 (CMS) ,持有財務顧問豁免(Exempt Financial Adviser)資質。本內容未經新加坡金融管理局的審查。
在澳大利亞,moomoo上的金融產品和服務是通過Futu Securities (Australia) Ltd提供,該公司是受澳大利亞證券和投資委員會(ASIC)監管的澳大利亞金融服務許可機構(AFSL No. 224663)。請閱讀並理解我們的《金融服務指南》、《條款與條件》、《隱私政策》和其他披露文件,這些文件可在我們的網站 https://www.moomoo.com/au中獲取。
在加拿大,透過moomoo應用程式提供的僅限訂單執行的券商服務由Moomoo Financial Canada Inc.提供,並受加拿大投資監管機構(CIRO)監管。
在馬來西亞,moomoo上的投資產品和服務是透過Moomoo Securities Malaysia Sdn. Bhd. 提供,該公司受馬來西亞證券監督委員會(SC)監管(牌照號碼︰eCMSL/A0397/2024) ,持有資本市場服務牌照 (CMSL) 。本內容未經馬來西亞證券監督委員會的審查。
Moomoo Technologies Inc., Moomoo Financial Inc., Moomoo Financial Singapore Pte. Ltd.,Futu Securities (Australia) Ltd, Moomoo Financial Canada Inc和Moomoo Securities Malaysia Sdn. Bhd., 是關聯公司。
- 分享到weixin
- 分享到qq
- 分享到facebook
- 分享到twitter
- 分享到微博
- 粘贴板
使用瀏覽器的分享功能,分享給你的好友吧