
-
市場
-
產品
-
資訊
-
Moo社區
-
課堂
-
查看更多
-
功能介紹
-
費用費用透明,無最低余額限制
投資選擇、功能介紹、費用相關信息由Moomoo Financial Inc.提供
- English
- 中文繁體
- 中文简体
- 深色
- 淺色
Shareholders in BOC Hong Kong (Holdings) (HKG:2388) Are in the Red If They Invested Five Years Ago
Shareholders in BOC Hong Kong (Holdings) (HKG:2388) Are in the Red If They Invested Five Years Ago
It's possible to achieve returns close to the market-weighted average return by buying an index fund. A talented investor can beat the market with a diversified portfolio, but even then, some stocks will under-perform. While the BOC Hong Kong (Holdings) Limited (HKG:2388) share price is down 34% over half a decade, the total return to shareholders (which includes dividends) was -17%. That's better than the market which declined 25% over the same time. Shareholders have had an even rougher run lately, with the share price down 13% in the last 90 days. However, one could argue that the price has been influenced by the general market, which is down 19% in the same timeframe.
With that in mind, it's worth seeing if the company's underlying fundamentals have been the driver of long term performance, or if there are some discrepancies.
See our latest analysis for BOC Hong Kong (Holdings)
In his essay The Superinvestors of Graham-and-Doddsville Warren Buffett described how share prices do not always rationally reflect the value of a business. One flawed but reasonable way to assess how sentiment around a company has changed is to compare the earnings per share (EPS) with the share price.
Looking back five years, both BOC Hong Kong (Holdings)'s share price and EPS declined; the latter at a rate of 3.0% per year. This reduction in EPS is less than the 8% annual reduction in the share price. So it seems the market was too confident about the business, in the past. The less favorable sentiment is reflected in its current P/E ratio of 10.81.
The image below shows how EPS has tracked over time (if you click on the image you can see greater detail).
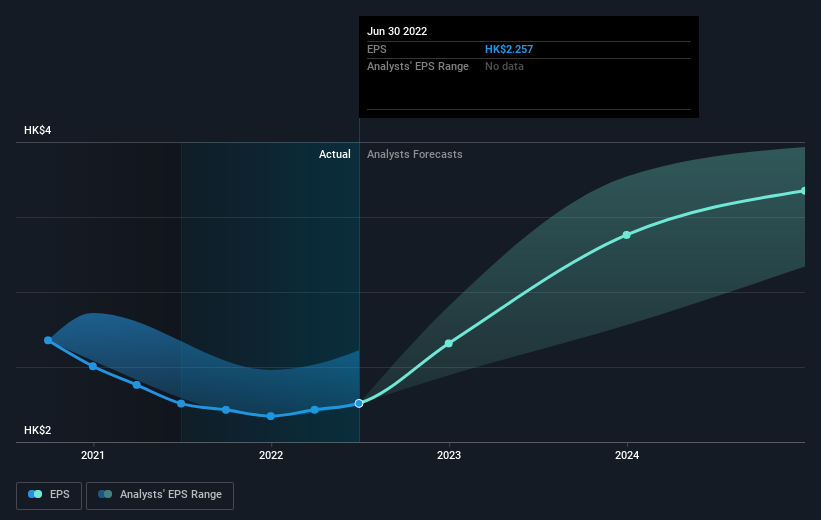 SEHK:2388 Earnings Per Share Growth November 2nd 2022
Dive deeper into BOC Hong Kong (Holdings)'s key metrics by checking this interactive graph of BOC Hong Kong (Holdings)'s earnings, revenue and cash flow.
What About Dividends?
When looking at investment returns, it is important to consider the difference between total shareholder return (TSR) and share price return. Whereas the share price return only reflects the change in the share price, the TSR includes the value of dividends (assuming they were reinvested) and the benefit of any discounted capital raising or spin-off. It's fair to say that the TSR gives a more complete picture for stocks that pay a dividend. As it happens, BOC Hong Kong (Holdings)'s TSR for the last 5 years was -17%, which exceeds the share price return mentioned earlier. And there's no prize for guessing that the dividend payments largely explain the divergence!
A Different Perspective
It's good to see that BOC Hong Kong (Holdings) has rewarded shareholders with a total shareholder return of 1.7% in the last twelve months. That's including the dividend. That certainly beats the loss of about 3% per year over the last half decade. We generally put more weight on the long term performance over the short term, but the recent improvement could hint at a (positive) inflection point within the business. While it is well worth considering the different impacts that market conditions can have on the share price, there are other factors that are even more important. For instance, we've identified 1 warning sign for BOC Hong Kong (Holdings) that you should be aware of.
If you like to buy stocks alongside management, then you might just love this free list of companies. (Hint: insiders have been buying them).
Please note, the market returns quoted in this article reflect the market weighted average returns of stocks that currently trade on HK exchanges.
Have feedback on this article? Concerned about the content? Get in touch with us directly. Alternatively, email editorial-team (at) simplywallst.com.
This article by Simply Wall St is general in nature. We provide commentary based on historical data and analyst forecasts only using an unbiased methodology and our articles are not intended to be financial advice. It does not constitute a recommendation to buy or sell any stock, and does not take account of your objectives, or your financial situation. We aim to bring you long-term focused analysis driven by fundamental data. Note that our analysis may not factor in the latest price-sensitive company announcements or qualitative material. Simply Wall St has no position in any stocks mentioned.
通過購買指數基金,可以獲得接近市場加權平均回報的回報。一位才華橫溢的投資者可以通過多元化的投資組合擊敗市場,但即使這樣,一些股票的表現也會不佳。而當中銀香港(集團)有限公司(HKG:2388)股價在過去五年下跌34%,股東總回報率(包括股息)為-17%。這比同期下跌25%的市場要好。股東們最近的表現更加艱難,股價在過去90天裏下跌了13%。然而,有人可能會辯稱,價格受到了大盤的影響,大盤在同一時間段內下跌了19%。
考慮到這一點,值得關注的是,該公司的潛在基本面是長期業績的驅動力,還是存在一些差異。
參見我們對中銀香港(控股)的最新分析
在他的文章中格雷厄姆和多德斯維爾的超級投資者沃倫·巴菲特描述了股價並不總是理性地反映一家企業的價值。評估圍繞一家公司的情緒變化的一個有缺陷但合理的方法是將每股收益(EPS)與股價進行比較。
回顧五年前,中銀香港(控股)的股價和每股收益都在下降;後者以每年3.0%的速度下降。每股收益的下降幅度小於股價每年下降8%的幅度。因此,市場似乎對過去的業務過於自信。不太樂觀的情緒反映在其目前10.81的市盈率上。
下圖顯示了EPS是如何隨着時間的推移進行跟蹤的(如果您點擊該圖像,您可以看到更多詳細信息)。
聯交所:每股盈利增長2388 2022年11月2日通過查看這張中銀香港(控股)的收益、收入和現金流的互動圖,更深入地研究中銀香港(控股)的關鍵指標。
那股息呢?
在考察投資回報時,重要的是要考慮到股東總回報(TSR)和股價回報。雖然股價回報只反映股價的變動,但TSR包括股息的價值(假設股息再投資),以及任何折價集資或分拆所帶來的利益。公平地説,TSR為支付股息的股票提供了更完整的圖景。碰巧的是,中銀香港(控股)最近5年的總回報率為-17%,超過了前面提到的股價回報率。而且,猜測股息支付在很大程度上解釋了這種差異是沒有好處的!
不同的視角
很高興看到中銀香港(控股)在過去的12個月裏為股東帶來了1.7%的總回報。這還包括股息。這當然超過了過去五年每年約3%的損失。我們通常更看重短期的長期表現,但最近的改善可能暗示着業務內部出現(積極的)拐點。雖然值得考慮市場狀況對股價可能產生的不同影響,但還有其他更重要的因素。例如,我們已經確定中銀香港(控股)1個警告標誌這一點你應該知道。
如果你喜歡和管理層一起買股票,那麼你可能會喜歡這本書免費公司名單。(提示:內部人士一直在買入這些股票)。
請注意,本文引用的市場回報反映了目前在香港交易所交易的股票的市場加權平均回報。
對這篇文章有什麼反饋嗎?擔心內容嗎? 保持聯繫直接與我們聯繫。或者,也可以給編輯組發電子郵件,地址是implywallst.com。
本文由Simply Wall St.撰寫,具有概括性。我們僅使用不偏不倚的方法提供基於歷史數據和分析師預測的評論,我們的文章並不打算作為財務建議。它不構成買賣任何股票的建議,也沒有考慮你的目標或你的財務狀況。我們的目標是為您帶來由基本面數據驅動的長期重點分析。請注意,我們的分析可能不會將最新的對價格敏感的公司公告或定性材料考慮在內。Simply Wall St.對上述任何一隻股票都沒有持倉。
moomoo是Moomoo Technologies Inc.公司提供的金融資訊和交易應用程式。
在美國,moomoo上的投資產品和服務由Moomoo Financial Inc.提供,一家受美國證券交易委員會(SEC)監管的持牌主體。 Moomoo Financial Inc.是金融業監管局(FINRA)和證券投資者保護公司(SIPC)的成員。
在新加坡,moomoo上的投資產品和服務是通過Moomoo Financial Singapore Pte. Ltd.提供,該公司受新加坡金融管理局(MAS)監管(牌照號碼︰CMS101000) ,持有資本市場服務牌照 (CMS) ,持有財務顧問豁免(Exempt Financial Adviser)資質。本內容未經新加坡金融管理局的審查。
在澳大利亞,moomoo上的金融產品和服務是通過Futu Securities (Australia) Ltd提供,該公司是受澳大利亞證券和投資委員會(ASIC)監管的澳大利亞金融服務許可機構(AFSL No. 224663)。請閱讀並理解我們的《金融服務指南》、《條款與條件》、《隱私政策》和其他披露文件,這些文件可在我們的網站 https://www.moomoo.com/au中獲取。
在加拿大,透過moomoo應用程式提供的僅限訂單執行的券商服務由Moomoo Financial Canada Inc.提供,並受加拿大投資監管機構(CIRO)監管。
在馬來西亞,moomoo上的投資產品和服務是透過Moomoo Securities Malaysia Sdn. Bhd. 提供,該公司受馬來西亞證券監督委員會(SC)監管(牌照號碼︰eCMSL/A0397/2024) ,持有資本市場服務牌照 (CMSL) 。本內容未經馬來西亞證券監督委員會的審查。
Moomoo Technologies Inc., Moomoo Financial Inc., Moomoo Financial Singapore Pte. Ltd.,Futu Securities (Australia) Ltd, Moomoo Financial Canada Inc和Moomoo Securities Malaysia Sdn. Bhd., 是關聯公司。
風險及免責聲明
moomoo是Moomoo Technologies Inc.公司提供的金融資訊和交易應用程式。
在美國,moomoo上的投資產品和服務由Moomoo Financial Inc.提供,一家受美國證券交易委員會(SEC)監管的持牌主體。 Moomoo Financial Inc.是金融業監管局(FINRA)和證券投資者保護公司(SIPC)的成員。
在新加坡,moomoo上的投資產品和服務是通過Moomoo Financial Singapore Pte. Ltd.提供,該公司受新加坡金融管理局(MAS)監管(牌照號碼︰CMS101000) ,持有資本市場服務牌照 (CMS) ,持有財務顧問豁免(Exempt Financial Adviser)資質。本內容未經新加坡金融管理局的審查。
在澳大利亞,moomoo上的金融產品和服務是通過Futu Securities (Australia) Ltd提供,該公司是受澳大利亞證券和投資委員會(ASIC)監管的澳大利亞金融服務許可機構(AFSL No. 224663)。請閱讀並理解我們的《金融服務指南》、《條款與條件》、《隱私政策》和其他披露文件,這些文件可在我們的網站 https://www.moomoo.com/au中獲取。
在加拿大,透過moomoo應用程式提供的僅限訂單執行的券商服務由Moomoo Financial Canada Inc.提供,並受加拿大投資監管機構(CIRO)監管。
在馬來西亞,moomoo上的投資產品和服務是透過Moomoo Securities Malaysia Sdn. Bhd. 提供,該公司受馬來西亞證券監督委員會(SC)監管(牌照號碼︰eCMSL/A0397/2024) ,持有資本市場服務牌照 (CMSL) 。本內容未經馬來西亞證券監督委員會的審查。
Moomoo Technologies Inc., Moomoo Financial Inc., Moomoo Financial Singapore Pte. Ltd.,Futu Securities (Australia) Ltd, Moomoo Financial Canada Inc和Moomoo Securities Malaysia Sdn. Bhd., 是關聯公司。
- 分享到weixin
- 分享到qq
- 分享到facebook
- 分享到twitter
- 分享到微博
- 粘贴板
使用瀏覽器的分享功能,分享給你的好友吧