
-
市場
-
產品
-
資訊
-
Moo社區
-
課堂
-
查看更多
-
功能介紹
-
費用費用透明,無最低余額限制
投資選擇、功能介紹、費用相關信息由Moomoo Financial Inc.提供
- English
- 中文繁體
- 中文简体
- 深色
- 淺色
Those who invested in Zibo Qixiang Tengda Chemical (SZSE:002408) three years ago are up 48%
Those who invested in Zibo Qixiang Tengda Chemical (SZSE:002408) three years ago are up 48%
By buying an index fund, investors can approximate the average market return. But if you pick the right individual stocks, you could make more than that. For example, Zibo Qixiang Tengda Chemical Co., Ltd (SZSE:002408) shareholders have seen the share price rise 43% over three years, well in excess of the market return (28%, not including dividends).
So let's assess the underlying fundamentals over the last 3 years and see if they've moved in lock-step with shareholder returns.
See our latest analysis for Zibo Qixiang Tengda Chemical
In his essay The Superinvestors of Graham-and-Doddsville Warren Buffett described how share prices do not always rationally reflect the value of a business. By comparing earnings per share (EPS) and share price changes over time, we can get a feel for how investor attitudes to a company have morphed over time.
Zibo Qixiang Tengda Chemical was able to grow its EPS at 37% per year over three years, sending the share price higher. This EPS growth is higher than the 13% average annual increase in the share price. So it seems investors have become more cautious about the company, over time. This cautious sentiment is reflected in its (fairly low) P/E ratio of 9.64.
The graphic below depicts how EPS has changed over time (unveil the exact values by clicking on the image).
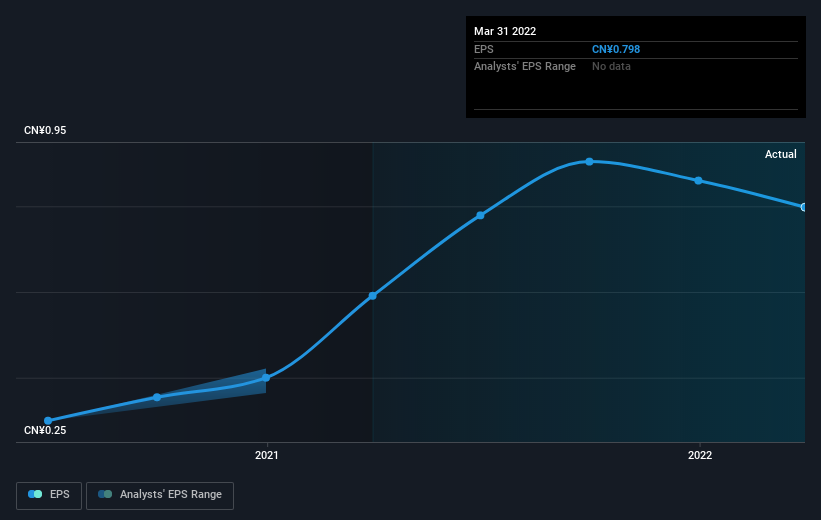 SZSE:002408 Earnings Per Share Growth July 27th 2022
It's probably worth noting that the CEO is paid less than the median at similar sized companies. It's always worth keeping an eye on CEO pay, but a more important question is whether the company will grow earnings throughout the years. It might be well worthwhile taking a look at our free report on Zibo Qixiang Tengda Chemical's earnings, revenue and cash flow.
What About The Total Shareholder Return (TSR)?
Investors should note that there's a difference between Zibo Qixiang Tengda Chemical's total shareholder return (TSR) and its share price change, which we've covered above. The TSR is a return calculation that accounts for the value of cash dividends (assuming that any dividend received was reinvested) and the calculated value of any discounted capital raisings and spin-offs. Its history of dividend payouts mean that Zibo Qixiang Tengda Chemical's TSR of 48% over the last 3 years is better than the share price return.
A Different Perspective
Zibo Qixiang Tengda Chemical shareholders are down 8.7% over twelve months, which isn't far from the market return of -8.3%. So last year was actually even worse than the last five years, which cost shareholders 1.3% per year. It will probably take a substantial improvement in the fundamental performance for the company to reverse this trend. I find it very interesting to look at share price over the long term as a proxy for business performance. But to truly gain insight, we need to consider other information, too. Take risks, for example - Zibo Qixiang Tengda Chemical has 2 warning signs (and 1 which doesn't sit too well with us) we think you should know about.
Of course, you might find a fantastic investment by looking elsewhere. So take a peek at this free list of companies we expect will grow earnings.
Please note, the market returns quoted in this article reflect the market weighted average returns of stocks that currently trade on CN exchanges.
Have feedback on this article? Concerned about the content? Get in touch with us directly. Alternatively, email editorial-team (at) simplywallst.com.
This article by Simply Wall St is general in nature. We provide commentary based on historical data and analyst forecasts only using an unbiased methodology and our articles are not intended to be financial advice. It does not constitute a recommendation to buy or sell any stock, and does not take account of your objectives, or your financial situation. We aim to bring you long-term focused analysis driven by fundamental data. Note that our analysis may not factor in the latest price-sensitive company announcements or qualitative material. Simply Wall St has no position in any stocks mentioned.
通過購買指數基金,投資者可以接近平均市場回報。但如果你選擇了正確的個股,你可以賺得更多。例如,淄博市齊鄉市騰達化工有限公司(SZSE:002408)股東的股價在三年內上漲了43%,遠遠超過市場回報率(28%,不包括股息)。
因此,讓我們評估一下過去3年的基本基本面,看看它們是否與股東回報同步。
請參閲我們對淄博齊翔騰達化工的最新分析
在他的文章中格雷厄姆和多德斯維爾的超級投資者沃倫·巴菲特描述了股價並不總是理性地反映一家企業的價值。通過比較每股收益(EPS)和股價隨時間的變化,我們可以感受到投資者對一家公司的態度隨着時間的推移發生了怎樣的變化。
三年來,淄博齊翔騰達化工的每股收益以每年37%的速度增長,股價因此走高。這一EPS增幅高於該公司股價13%的年均增幅。因此,隨着時間的推移,投資者似乎對該公司變得更加謹慎了。這種謹慎的情緒反映在(相當低的)市盈率9.64。
下圖描述了EPS是如何隨着時間的推移而變化的(通過單擊圖像來揭示確切的值)。
上交所:2022年7月27日每股收益增長002408可能值得注意的是,首席執行官的薪酬低於類似規模公司的中位數。關注首席執行官的薪酬總是值得的,但更重要的問題是,該公司是否會在未來幾年實現盈利增長。也許很值得一看我們的免費淄博齊翔騰達化工的收益、收入和現金流報告。
那麼總股東回報(TSR)呢?
投資者應該注意到,我們前面已經介紹過的,淄博齊翔騰達化工的總股東回報(TSR)與其股價變化之間存在差異。TSR是一種回報計算,計入了現金股息的價值(假設收到的任何股息都進行了再投資),以及任何貼現融資和剝離的計算價值。其派息的歷史意味着,淄博齊翔騰達化工過去3年48%的TSR好於股價回報。
不同的視角
在過去的12個月裏,淄博齊翔騰達化工的持股量累計下跌了8.7%,與-8.3%的市場回報率相差不遠。因此,去年實際上比過去五年還要糟糕,過去五年股東每年損失1.3%。該公司可能需要基本面業績的大幅改善才能扭轉這一趨勢。我發現,把股價作為衡量企業業績的長期指標是非常有趣的。但為了真正獲得洞察力,我們還需要考慮其他信息。以風險為例--淄博齊翔騰達化工2個警告標誌(1)我們認為你應該知道這一點。
當然了,如果你把目光投向別處,你可能會發現這是一筆很棒的投資。所以讓我們來看看這個免費我們預計收益將會增長的公司名單。
請注意,本文引用的市場回報反映了目前在CN交易所交易的股票的市場加權平均回報。
對這篇文章有什麼反饋嗎?擔心內容嗎? 保持聯繫直接與我們聯繫。或者,也可以給編輯組發電子郵件,地址是implywallst.com。
本文由Simply Wall St.撰寫,具有概括性。我們僅使用不偏不倚的方法提供基於歷史數據和分析師預測的評論,我們的文章並不打算作為財務建議。它不構成買賣任何股票的建議,也沒有考慮你的目標或你的財務狀況。我們的目標是為您帶來由基本面數據驅動的長期重點分析。請注意,我們的分析可能不會將最新的對價格敏感的公司公告或定性材料考慮在內。Simply Wall St.對上述任何一隻股票都沒有持倉。
moomoo是Moomoo Technologies Inc.公司提供的金融資訊和交易應用程式。
在美國,moomoo上的投資產品和服務由Moomoo Financial Inc.提供,一家受美國證券交易委員會(SEC)監管的持牌主體。 Moomoo Financial Inc.是金融業監管局(FINRA)和證券投資者保護公司(SIPC)的成員。
在新加坡,moomoo上的投資產品和服務是通過Moomoo Financial Singapore Pte. Ltd.提供,該公司受新加坡金融管理局(MAS)監管(牌照號碼︰CMS101000) ,持有資本市場服務牌照 (CMS) ,持有財務顧問豁免(Exempt Financial Adviser)資質。本內容未經新加坡金融管理局的審查。
在澳大利亞,moomoo上的金融產品和服務是通過Futu Securities (Australia) Ltd提供,該公司是受澳大利亞證券和投資委員會(ASIC)監管的澳大利亞金融服務許可機構(AFSL No. 224663)。請閱讀並理解我們的《金融服務指南》、《條款與條件》、《隱私政策》和其他披露文件,這些文件可在我們的網站 https://www.moomoo.com/au中獲取。
在加拿大,透過moomoo應用程式提供的僅限訂單執行的券商服務由Moomoo Financial Canada Inc.提供,並受加拿大投資監管機構(CIRO)監管。
在馬來西亞,moomoo上的投資產品和服務是透過Moomoo Securities Malaysia Sdn. Bhd. 提供,該公司受馬來西亞證券監督委員會(SC)監管(牌照號碼︰eCMSL/A0397/2024) ,持有資本市場服務牌照 (CMSL) 。本內容未經馬來西亞證券監督委員會的審查。
Moomoo Technologies Inc., Moomoo Financial Inc., Moomoo Financial Singapore Pte. Ltd.,Futu Securities (Australia) Ltd, Moomoo Financial Canada Inc和Moomoo Securities Malaysia Sdn. Bhd., 是關聯公司。
風險及免責聲明
moomoo是Moomoo Technologies Inc.公司提供的金融資訊和交易應用程式。
在美國,moomoo上的投資產品和服務由Moomoo Financial Inc.提供,一家受美國證券交易委員會(SEC)監管的持牌主體。 Moomoo Financial Inc.是金融業監管局(FINRA)和證券投資者保護公司(SIPC)的成員。
在新加坡,moomoo上的投資產品和服務是通過Moomoo Financial Singapore Pte. Ltd.提供,該公司受新加坡金融管理局(MAS)監管(牌照號碼︰CMS101000) ,持有資本市場服務牌照 (CMS) ,持有財務顧問豁免(Exempt Financial Adviser)資質。本內容未經新加坡金融管理局的審查。
在澳大利亞,moomoo上的金融產品和服務是通過Futu Securities (Australia) Ltd提供,該公司是受澳大利亞證券和投資委員會(ASIC)監管的澳大利亞金融服務許可機構(AFSL No. 224663)。請閱讀並理解我們的《金融服務指南》、《條款與條件》、《隱私政策》和其他披露文件,這些文件可在我們的網站 https://www.moomoo.com/au中獲取。
在加拿大,透過moomoo應用程式提供的僅限訂單執行的券商服務由Moomoo Financial Canada Inc.提供,並受加拿大投資監管機構(CIRO)監管。
在馬來西亞,moomoo上的投資產品和服務是透過Moomoo Securities Malaysia Sdn. Bhd. 提供,該公司受馬來西亞證券監督委員會(SC)監管(牌照號碼︰eCMSL/A0397/2024) ,持有資本市場服務牌照 (CMSL) 。本內容未經馬來西亞證券監督委員會的審查。
Moomoo Technologies Inc., Moomoo Financial Inc., Moomoo Financial Singapore Pte. Ltd.,Futu Securities (Australia) Ltd, Moomoo Financial Canada Inc和Moomoo Securities Malaysia Sdn. Bhd., 是關聯公司。
- 分享到weixin
- 分享到qq
- 分享到facebook
- 分享到twitter
- 分享到微博
- 粘贴板
使用瀏覽器的分享功能,分享給你的好友吧