Stocks went sideways again yesterday, with the S&P 500 index dropping 0.02% from its Friday closing price. The market is dealing with uncertainty ahead of tomorrow’s consumer inflation data. This morning, we received the Producer Price Index number, which was higher than expected at +0.5% month-over-month. However, after the initial futures contract sell-off, the index is likely to open virtually flat.
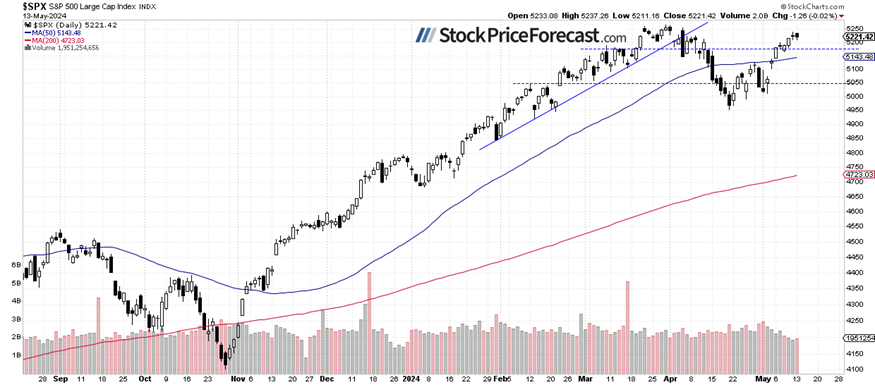
On Friday, the market reached a new local high of 5,239.66 and it was the highest since April 4. It has retraced almost all of its 311 points or 5.9% correction from the record high of 5,264.85 on February 28 to a local low of 4,953.56 on April 19. On Friday, the index was just 25 points below the all-time high.
Yesterday, I noted ”The question arises: will the S&P 500 continue its bull market and reach a new record? It seems more and more likely; however, the index may see some short-term uncertainty as it approaches a series of the previous local highs and resistance levels.”
Last week, the investor sentiment has clearly improved, as indicated by the Wednesday’s AAII Investor Sentiment Survey, which showed that 40.8% of individual investors are bullish, while only 23.8% of them are bearish, down from 32.5% last week. The AAII sentiment is a contrary indicator in the sense that highly bullish readings may suggest excessive complacency and a lack of fear in the market. Conversely, bearish readings are favorable for market upturns.
The S&P 500 remains at a potential resistance level marked by its trading range from March and April, as we can see on the daily chart.
Nasdaq 100 treading waters above 18,000
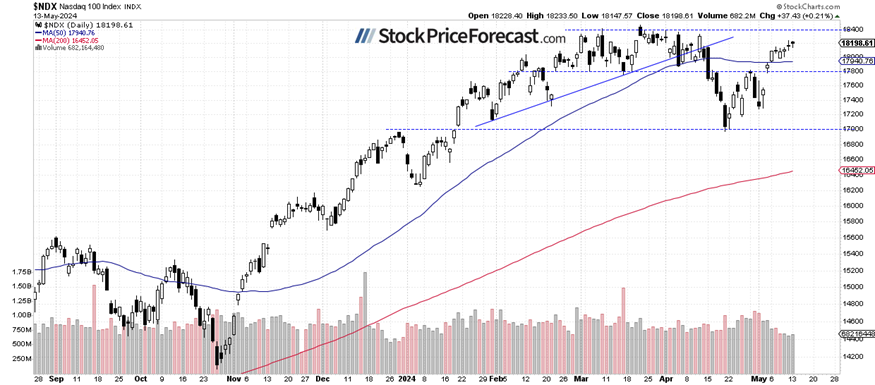
Last week, the technology-focused Nasdaq 100 index has been mostly fluctuating along the 18,000 level. However, on Friday, it broke higher and retraced more of its previous declines. Potential resistance level remains at 18,400-18,500, marked by the March 21 record high of 18,464.70. Today, the tech stocks gauge is likely to open 0.2% lower following producer inflation data.
VIX – Rebound from 12.50
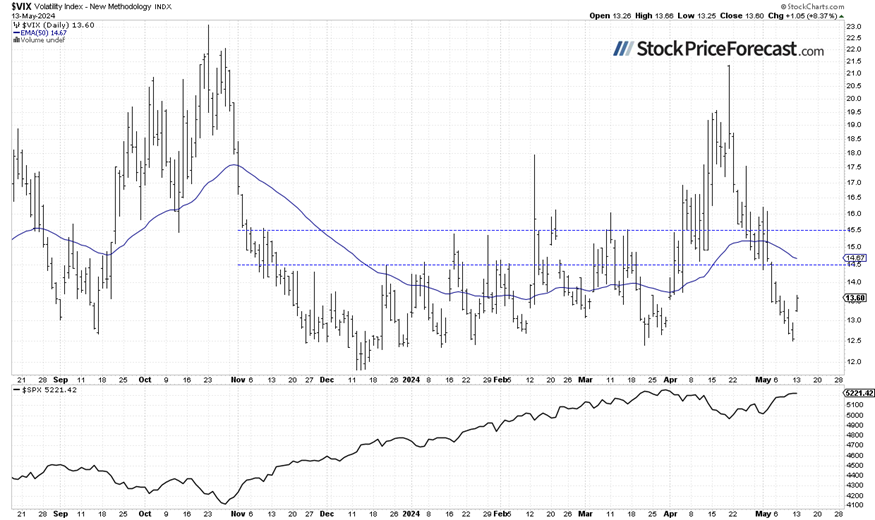
The VIX index, also known as the fear gauge, is derived from option prices. In late March, it was trading around the 13 level. However, market volatility led to an increase in the VIX, and on April 19, it reached a local high of 21.4 - the highest since late October, signaling fear in the market. Recently, it was going lower again, and on Friday, it was as low as 12.50, showing complacency in the market. Yesterday, VIX rebounded above the 13 mark despite a relatively calm trading session in stocks.
Historically, a dropping VIX indicates less fear in the market, and rising VIX accompanies stock market downturns. However, the lower the VIX, the higher the probability of the market’s downward reversal.
Futures contract drops after PPI data
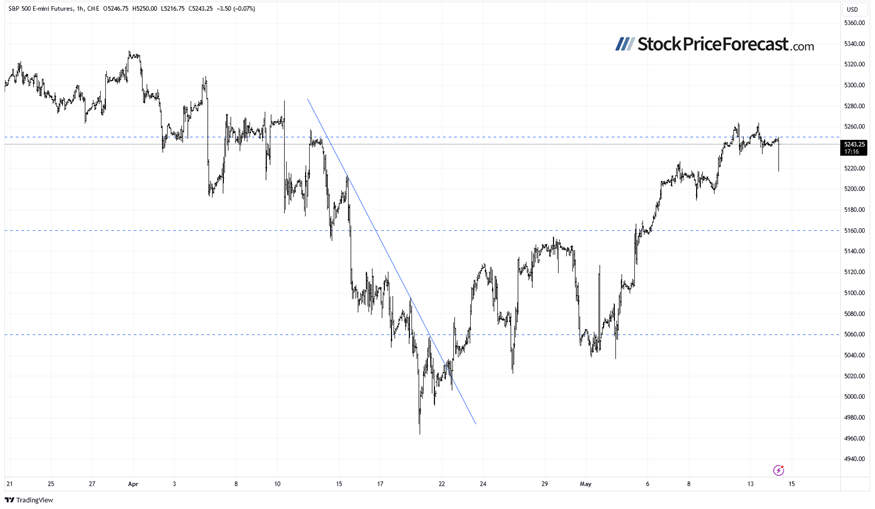
Let’s take a look at the hourly chart of the S&P 500 futures contract. The producer inflation data led to a breakdown below the recent trading range along the 5,250 level. The market fell to a local low of around 5,217 before quickly rebounding.
The resistance level is at 5,300, and the support level is at 5,200-5,220, marked by recent fluctuations.
Conclusion
Stocks are likely to open virtually flat following the PPI number release. The market recovered most of its earlier losses and it may see more uncertainty and sideways trading action.
Last Tuesday, I wrote “(…) the market may pause or even retrace some gains. With most of the earnings season over (there is only one very important release left - NVDA on May 22) and the FOMC Rate Decision release behind us, expect a period of uncertainty.”
The uncertainty seemed to be gone, but the overall bullish sentiment coupled with low VIX readings may be worrying for the market in the short-term. Some profit-taking may be on the horizon.
In my Stock Price Forecast for May, I noted “Where will the market go in May? There's a popular saying: 'Sell in May and go away,' but statistics don't consistently support such clear seasonal patterns or cycles. The safe bet for May is likely sideways trading, with investors digesting recent data suggesting that inflation may not be transitory, and the Fed could maintain its relatively tight monetary policy. However, economic data isn't entirely negative, and strong earnings from companies may continue to fuel the bull market.”
For now, my short-term outlook remains neutral.
Here’s the breakdown:
-
The S&P 500 is likely to extend its short-term consolidation despite higher-than-expected producer inflation number.
-
On Friday, April 19, stock prices were the lowest since February, indicating a correction of the medium-term advance. Recently, the S&P 500 retraced all of its mid-April sell-off.
-
In my opinion, the short-term outlook is neutral.
The full version of today’s analysis - today’s Stock Trading Alert - is bigger than what you read above, and it includes the additional analysis of the Apple (AAPL) stock and the current S&P 500 futures contract position. I encourage you to subscribe and read the details today. Stocks Trading Alerts are also a part of our Diamond Package that includes Gold Trading Alerts and Oil Trading Alerts.
Want free follow-ups to the above article and details not available to 99%+ investors? Sign up to our free newsletter today!
All essays, research and information found above represent analyses and opinions of Przemyslaw Radomski, CFA and Sunshine Profits' employees and associates only. As such, it may prove wrong and be a subject to change without notice. Opinions and analyses were based on data available to authors of respective essays at the time of writing. Although the information provided above is based on careful research and sources that are believed to be accurate, Przemyslaw Radomski, CFA and his associates do not guarantee the accuracy or thoroughness of the data or information reported. The opinions published above are neither an offer nor a recommendation to purchase or sell any securities. Mr. Radomski is not a Registered Securities Advisor. By reading Przemyslaw Radomski's, CFA reports you fully agree that he will not be held responsible or liable for any decisions you make regarding any information provided in these reports. Investing, trading and speculation in any financial markets may involve high risk of loss. Przemyslaw Radomski, CFA, Sunshine Profits' employees and affiliates as well as members of their families may have a short or long position in any securities, including those mentioned in any of the reports or essays, and may make additional purchases and/or sales of those securities without notice.
Recommended content
Editors’ Picks
EUR/USD keeps range near 1.0850 ahead of German inflation data

EUR/USD keeps calm near 1.0850 in the European session on Wednesday. The pair faces challenges amid risk aversion and higher US Treasury bond yields, even as the US Dollar struggles to find its feet. German inflation data is next in focus.
GBP/USD recovers above 1.2750 as US Dollar struggles

GBP/USD recovers ground above 1.2750 in European trading on Wednesday. The US Dollar loses its upside momentum, despite diminishing bets of a Sept Fed rate cut and a risk-off market mood. Fedspeak remains on the radar.
Gold buyers take a breather but technicals stay bullish

Gold price is posting small losses below $2,360, pausing a three-day recovery early Wednesday. The US Dollar resurgence acts as a headwind for the Gold price, despite heigthening Middle East tensions and a pick up in Indian physical Gold demand.
Digital asset inflows reach record high year-to-date

CoinShares' weekly digital asset flows, released on Tuesday, reveal that digital assets recorded a three-week consecutive rise in inflows, amounting to a record high of $14.9 billion already this year.
Inflation week: Eyes on Germany’s numbers, Eurozone and the US PCE

Today we get Germany’s numbers and on Friday, both the Eurozone and the US PCE. For the Eurozone, expectations are for core to remain the same at 2.7% and for the ECB to cut in June. This is being named a “hawkish cut,” one of those inherently self-contradictory terms.


