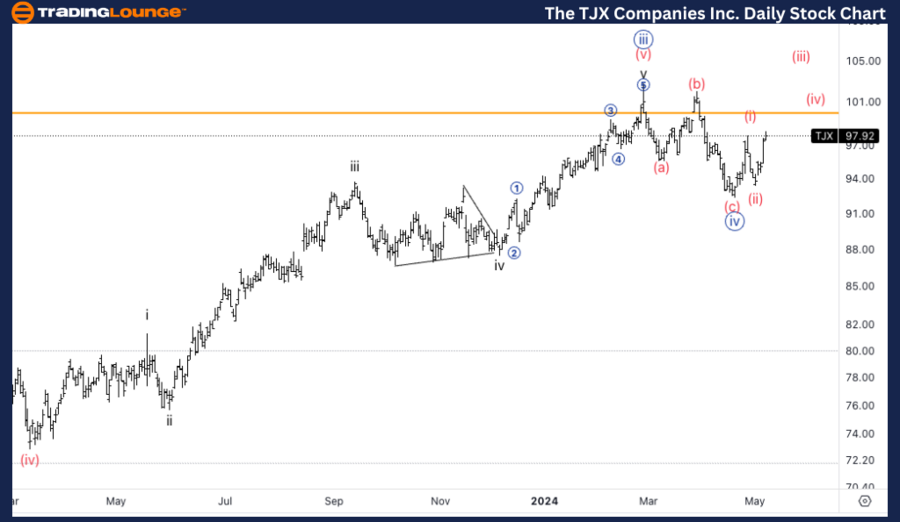
TJX Elliott Wave Analysis Trading Lounge Daily Chart,
The TJX Companies Inc., (TJX) Daily Chart
TJX Elliott Wave technical analysis
Function: Trend.
Mode: Impulsive.
Structure: Motive.
Position: Minute wave {v}.
Direction: Upside in Minute {v}.
Details: Looking for a bottom in wave {iv} in place to then continue higher. Equality of {v} vs. {i} stands at 108$.
Our detailed Elliott Wave analysis for The TJX Companies Inc. (TJX) as of May 7, 2024, offers insightful perspectives on potential movements for both daily and 4-hour trading charts. This analysis aims to assist traders and investors in identifying strategic positions in line with the predicted trends in TJX's stock prices.
TJX Elliott Wave Technical Analysis – Daily chart
On the daily chart, TJX is currently exhibiting an impulsive, motive wave pattern, specifically within Minute wave {v}. This wave is crucial as it suggests a continued upward momentum following the establishment of a bottom in wave {iv}. The target for equality between wave {v} and wave {i} is projected at $108, indicating significant upside potential.
TJX Elliott Wave Analysis Trading Lounge 4Hr Chart
The TJX Companies Inc., (TJX) 4Hr Chart
TJX Elliott Wave technical analysis
Function: Trend.
Mode: Impulsive.
Structure: Motive.
Position: Wave (i) of {v}.
Direction: Upside in wave (iii).
Details: Looking for a CTLP on 100$, we need to break (b) to then start thinking about longs.
TJX Elliott Wave technical analysis – Four hour chart
Zooming into the 4-hour chart, TJX is progressing through Wave (i) of Minute {v}. The focus is on the upcoming wave (iii), which is known for its typically strong upward drive. A critical price point to monitor is the $100 level, where a conclusive break above the (b) wave high will validate bullish sentiments and open the door for positioning long trades.
Technical analyst: Alessio Barretta.
TJX Elliott Wave technical analysis [Video]
As with any investment opportunity there is a risk of making losses on investments that Trading Lounge expresses opinions on.
Historical results are no guarantee of future returns. Some investments are inherently riskier than others. At worst, you could lose your entire investment. TradingLounge™ uses a range of technical analysis tools, software and basic fundamental analysis as well as economic forecasts aimed at minimizing the potential for loss.
The advice we provide through our TradingLounge™ websites and our TradingLounge™ Membership has been prepared without considering your objectives, financial situation or needs. Reliance on such advice, information or data is at your own risk. The decision to trade and the method of trading is for you alone to decide. This information is of a general nature only, so you should, before acting upon any of the information or advice provided by us, consider the appropriateness of the advice considering your own objectives, financial situation or needs. Therefore, you should consult your financial advisor or accountant to determine whether trading in securities and derivatives products is appropriate for you considering your financial circumstances.
Recommended content
Editors’ Picks
EUR/USD retreats below 1.0850 after upbeat US PMI data

EUR/USD lost its traction and declined below 1.0850 in the American session on Thursday. Upbeat PMI data from the US, combined with the mixed action seen in Wall Street's main indexes, helps the US Dollar gather strength and weighs on the pair.
GBP/USD falls toward 1.2700 as USD benefits from PMI data

GBP/USD came under modest bearish pressure and declined toward 1.2700 in the second half of the day on Thursday. The US Dollar (USD) benefits from the PMI data, which showed an ongoing expansion in the private sector at an accelerating pace, and weighs on the pair.
Gold extends slide below $2,350.00

Gold stays on the back foot and trades at its lowest level in over a week below $2,350. The benchmark 10-year US Treasury bond yield rises more than 1% following the stronger-than-forecast PMI data from the US, forcing XAU/USD to stretch lower.
As Ethereum spot ETF approval nears, these altcoins could explode

It is not surprising that altcoins related to Bitcoin saw a major rally post-Bitcoin spot ETF approval. Likewise, tokens closely related to Ether could ride the ETF approval wave. Ethereum Classic, Pepe, Floki and other DeFi tokens could gain momentum as the ETH ETF approval deadline nears.
US S&P Global PMIs Preview: Economic expansion set to persist in May

On Thursday, S&P Global will issue its flash estimates of the United States (US) Purchasing Managers Indexes (PMIs), a monthly survey of business activity. The survey is separated into services and manufacturing output and aggregated into a single statistic, the Composite PMI.

