Equinor (EQNR) Q1 Earnings and Revenues Beat Estimates
Equinor ASA EQNR reported first-quarter 2024 adjusted earnings per share of 96 cents, which beat the Zacks Consensus Estimate of 78 cents. However, the bottom line declined from the year-ago quarter’s figure of $1.13.
Total quarterly revenues declined to $25,135 million from $29,224 million in the prior-year quarter. However, the top line beat the Zacks Consensus Estimate of $25,030 million.
Better-than-expected quarterly results can be attributed to increased production across major segments. This was partially offset by lower price of gas.
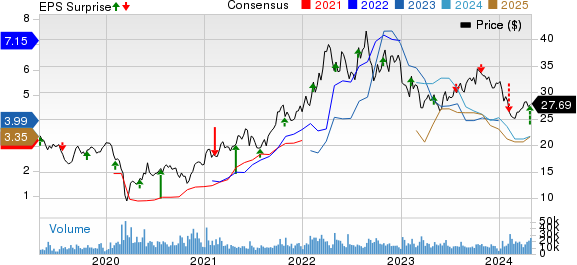
Equinor ASA Price, Consensus and EPS Surprise

Equinor ASA price-consensus-eps-surprise-chart | Equinor ASA Quote
Segmental Analysis
Exploration & Production Norway (E&P Norway): The segment reported adjusted earnings of $5,756 million, down 42% from $9,912 million registered in the year-ago quarter. Lower price of gas affected the segment.
The company’s average daily production of liquids and gas increased 1% year over year to 1,462 thousand barrels of oil equivalent per day (MBoe/d). The figure was also above our estimate of 1,403 Mboe/d. The strong performance can be attributed to consistently high production levels and operational efficiency at Johan Sverdrup, along with the successful ramp-up of Breidablikk, Njord and Hyme. This was partially offset by a sharp decline in gas price compared with that recorded a year ago.
E&P International: The segment’s adjusted operating profit totaled $616 million, up 10% from the year-ago quarter’s figure of $560 million. Higher liquids and gas production primarily aided the segment.
The average daily equity production of liquids and gas increased to 352 MBoe/d from 336 MBoe/d in the year-ago quarter and surpassed our estimate of 332 MBoe/d. The production increase can primarily be attributed to the positive effects of new wells in Argentina and Angola, along with the added contribution from the Buzzard field in the United Kingdom. Additionally, positive contributions from the Buzzard field in the United Kingdom and a notable decrease in turnaround activities in the first quarter further increased the overall production level.
E&P USA: Through the segment, Equinor generated an adjusted quarterly profit of $377 million, up 11% from $340 million in the March-end quarter of 2023. The segment was aided by the commencement of operations at the Vito field in 2023, which led to increased production in the Gulf of Mexico during the first quarter compared with the prior-year quarter’s level.
The integrated firm’s average equity production of liquids and gas was 350 MBoe/d, up from 347 MBoe/d in the year-ago period. The metric was also above our projection of 321 MBoe/d. Revenues saw a boost from increased price of liquids and higher production in the Gulf of Mexico. However, this was partially offset by reduced gas price affecting production in Appalachia.
Marketing, Midstream & Processing: The segment reported adjusted earnings of $887 million, down 31% from $1,278 million a year ago.
Renewables: The segment reported an adjusted loss of $70 million, narrower than a reported loss of $83 million in the year-ago quarter. Revenue growth was driven by onshore wind farms in Brazil and Poland, boosting third-party revenues in the first quarter of 2024. However, lower prices and higher costs from projects offset the positives.
Free Cash Flow
In the March-end quarter, Equinor generated a free cash flow of $8 million compared with $4,201 million in the year-ago period. The underperformance resulted from declining operating cash flows.
Balance Sheet
As of Mar 31, 2024, Equinor reported $9,737 million in cash and cash equivalents. The company’s long-term debt was $24,253 million.
Outlook
Equinor reiterated stable oil and gas production for 2024. Additionally, it expects to double its annual power production from renewable sources from that reported in 2023.
The company revealed its organic capital spending budget of $13 billion for the year.
Zacks Rank & Stocks to Consider
Equinor currently carries a Zacks Rank #3 (Hold).
Investors interested in the energy sector may look at some better-ranked stocks like SM Energy Company SM, EOG Resources Inc., EOG and PBF Energy Inc. PBF. While SM Energy sports a Zacks Rank #1 (Strong Buy), EOG Resources and PBF Energy carry a Zacks Rank #2 (Buy) each at present. You can see the complete list of today’s Zacks #1 Rank stocks here.
SM Energy Company is an independent oil and gas company, engaged in the exploration, exploitation, development, acquisition, and production of oil and gas in North America. SM currently has a Value Score of B.
The Zacks Consensus Estimate for SM’s 2024 and 2025 EPS is pegged at $6.33 and $6.96, respectively. The stock has witnessed upward earnings estimate revisions for 2024 and 2025 in the past seven days.
EOG Resources, an oil and gas exploration company, boasts attractive growth prospects, top-tier returns, and a disciplined management team, leveraging highly productive acreages in prime oil shale plays like the Permian and Eagle Ford.
The Zacks Consensus Estimate for EOG’s 2024 EPS is pegged at $12.30. The company has a Zacks Style Score of B for Value and A for Momentum. It has witnessed upward earnings estimate revisions for 2024 and 2025 in the past seven days.
PBF Energy operates with a diverse asset base of six refineries, boasting higher daily crude processing capacity and a complex refining system, enabling the production of superior-grade refined products.
The Zacks Consensus Estimate for PBF’s 2024 and 2025 EPS is pegged at $7.39 and $5.87, respectively. PBF currently has a Zacks Style Score of A for Value and A for Momentum. Over the past 30 days, PBF has witnessed upward earnings estimate revisions for 2024 and 2025.
Want the latest recommendations from Zacks Investment Research? Today, you can download 7 Best Stocks for the Next 30 Days. Click to get this free report
EOG Resources, Inc. (EOG) : Free Stock Analysis Report
SM Energy Company (SM) : Free Stock Analysis Report
PBF Energy Inc. (PBF) : Free Stock Analysis Report
Equinor ASA (EQNR) : Free Stock Analysis Report

 Yahoo Finance