
-
市场
-
产品
-
资讯
-
Moo社区
-
课堂
-
查看更多
-
功能介绍
-
费用费用透明,无最低余额限制
投资选择、功能介绍、费用相关信息由Moomoo Financial Inc.提供
- English
- 中文繁體
- 中文简体
- 深色
- 浅色
Chongqing Taiji Industry(Group) Co.,Ltd (SHSE:600129) Looks Inexpensive But Perhaps Not Attractive Enough
Chongqing Taiji Industry(Group) Co.,Ltd (SHSE:600129) Looks Inexpensive But Perhaps Not Attractive Enough
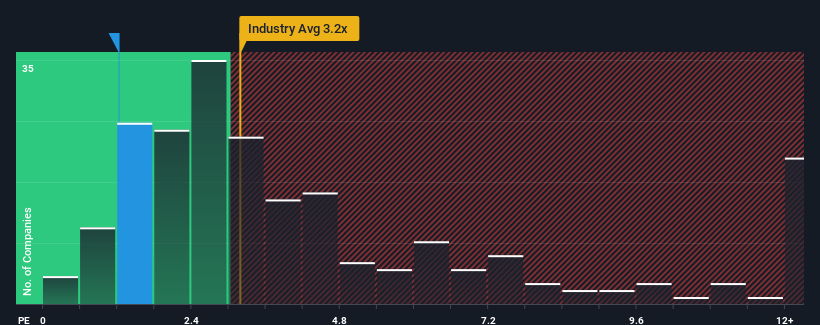
With a price-to-sales (or "P/S") ratio of 1.2x Chongqing Taiji Industry(Group) Co.,Ltd (SHSE:600129) may be sending bullish signals at the moment, given that almost half of all the Pharmaceuticals companies in China have P/S ratios greater than 3.2x and even P/S higher than 6x are not unusual. Nonetheless, we'd need to dig a little deeper to determine if there is a rational basis for the reduced P/S.
What Does Chongqing Taiji Industry(Group)Ltd's Recent Performance Look Like?
Recent times haven't been great for Chongqing Taiji Industry(Group)Ltd as its revenue has been rising slower than most other companies. It seems that many are expecting the uninspiring revenue performance to persist, which has repressed the growth of the P/S ratio. If you still like the company, you'd be hoping revenue doesn't get any worse and that you could pick up some stock while it's out of favour.
Keen to find out how analysts think Chongqing Taiji Industry(Group)Ltd's future stacks up against the industry? In that case, our free report is a great place to start.What Are Revenue Growth Metrics Telling Us About The Low P/S?
Chongqing Taiji Industry(Group)Ltd's P/S ratio would be typical for a company that's only expected to deliver limited growth, and importantly, perform worse than the industry.
Retrospectively, the last year delivered an exceptional 18% gain to the company's top line. The strong recent performance means it was also able to grow revenue by 38% in total over the last three years. So we can start by confirming that the company has done a great job of growing revenue over that time.
Shifting to the future, estimates from the nine analysts covering the company suggest revenue should grow by 27% over the next year. That's shaping up to be materially lower than the 43% growth forecast for the broader industry.
In light of this, it's understandable that Chongqing Taiji Industry(Group)Ltd's P/S sits below the majority of other companies. Apparently many shareholders weren't comfortable holding on while the company is potentially eyeing a less prosperous future.
The Bottom Line On Chongqing Taiji Industry(Group)Ltd's P/S
Using the price-to-sales ratio alone to determine if you should sell your stock isn't sensible, however it can be a practical guide to the company's future prospects.
As expected, our analysis of Chongqing Taiji Industry(Group)Ltd's analyst forecasts confirms that the company's underwhelming revenue outlook is a major contributor to its low P/S. Right now shareholders are accepting the low P/S as they concede future revenue probably won't provide any pleasant surprises. It's hard to see the share price rising strongly in the near future under these circumstances.
You should always think about risks. Case in point, we've spotted 1 warning sign for Chongqing Taiji Industry(Group)Ltd you should be aware of.
If companies with solid past earnings growth is up your alley, you may wish to see this free collection of other companies with strong earnings growth and low P/E ratios.
Have feedback on this article? Concerned about the content? Get in touch with us directly. Alternatively, email editorial-team (at) simplywallst.com.
This article by Simply Wall St is general in nature. We provide commentary based on historical data and analyst forecasts only using an unbiased methodology and our articles are not intended to be financial advice. It does not constitute a recommendation to buy or sell any stock, and does not take account of your objectives, or your financial situation. We aim to bring you long-term focused analysis driven by fundamental data. Note that our analysis may not factor in the latest price-sensitive company announcements or qualitative material. Simply Wall St has no position in any stocks mentioned.
市销率(或 “市销率”)为1.2倍重庆太极实业(集团)有限公司, Ltd(上海证券交易所股票代码:600129)目前可能正在发出看涨信号,因为中国几乎有一半的制药公司的市销率大于3.2倍,甚至市盈率高于6倍的情况并不少见。但是,我们需要更深入地挖掘以确定降低市销率是否有合理的依据。
重庆太极实业(集团)有限公司最近的表现如何?
重庆太极实业(集团)有限公司最近的情况并不好,因为其收入的增长速度比大多数其他公司都要慢。看来许多人预计平淡无奇的收入表现将持续下去,这抑制了市销率的增长。如果你仍然喜欢这家公司,你希望收入不会恶化,也希望在股票失宠的时候买入一些股票。
想了解分析师如何看待重庆太极实业(集团)有限公司的未来与该行业的对立吗?在这种情况下,我们的免费报告是一个很好的起点。收入增长指标告诉我们低市销率有哪些?
重庆太极实业(集团)有限公司的市销率对于一家预计增长有限,而且重要的是表现不如行业的公司来说是典型的。
回顾过去,去年的公司收入实现了18%的惊人增长。最近的强劲表现意味着它在过去三年中总收入增长了38%。因此,我们可以首先确认该公司在这段时间内在增加收入方面做得很好。
展望未来,报道该公司的九位分析师的估计表明,明年收入将增长27%。这将大大低于整个行业43%的增长预期。
有鉴于此,重庆太极实业(集团)有限公司的市销率低于其他多数公司是可以理解的。显然,许多股东不愿坚持下去,而该公司可能正在考虑不那么繁荣的未来。
重庆太极实业(集团)有限公司市销率的底线
仅使用市销率来确定是否应该出售股票是不明智的,但它可以作为公司未来前景的实用指南。
正如预期的那样,我们对重庆太极实业(集团)有限公司分析师预测的分析证实,该公司糟糕的收入前景是其低市销率的主要原因。目前,股东们正在接受低市销率,因为他们承认未来的收入可能不会带来任何惊喜。在这种情况下,很难看到股价在不久的将来强劲上涨。
你应该时刻考虑风险。举个例子,我们发现了你应该注意的重庆太极实业(集团)有限公司的1个警告标志。
如果过去盈利增长稳健的公司处于困境,那么你可能希望看到这些盈利增长强劲、市盈率低的其他公司的免费集合。
对这篇文章有反馈吗?对内容感到担忧?直接联系我们。 或者,给编辑团队 (at) simplywallst.com 发送电子邮件。
Simply Wall St的这篇文章本质上是笼统的。我们仅使用公正的方法根据历史数据和分析师的预测提供评论,我们的文章无意作为财务建议。它不构成买入或卖出任何股票的建议,也没有考虑到您的目标或财务状况。我们的目标是为您提供由基本数据驱动的长期重点分析。请注意,我们的分析可能不考虑最新的价格敏感型公司公告或定性材料。简而言之,华尔街没有持有任何上述股票的头寸。
moomoo是Moomoo Technologies Inc.公司提供的金融信息和交易应用程序。
在美国,moomoo上的投资产品和服务由Moomoo Financial Inc.提供,一家受美国证券交易委员会(SEC)监管的持牌主体。 Moomoo Financial Inc.是金融业监管局(FINRA)和证券投资者保护公司(SIPC)的成员。
在新加坡,moomoo上的投资产品和服务是通过Moomoo Financial Singapore Pte. Ltd.提供,该公司受新加坡金融管理局(MAS)监管(牌照号码︰CMS101000) ,持有资本市场服务牌照 (CMS) ,持有财务顾问豁免(Exempt Financial Adviser)资质。本内容未经新加坡金融管理局的审查。
在澳大利亚,moomoo上的金融产品和服务是通过Futu Securities (Australia) Ltd提供,该公司是受澳大利亚证券和投资委员会(ASIC)监管的澳大利亚金融服务许可机构(AFSL No. 224663)。请阅读并理解我们的《金融服务指南》、《条款与条件》、《隐私政策》和其他披露文件,这些文件可在我们的网站 https://www.moomoo.com/au中获取。
在加拿大,通过moomoo应用提供的仅限订单执行的券商服务由Moomoo Financial Canada Inc.提供,并受加拿大投资监管机构(CIRO)监管。
在马来西亚,moomoo上的投资产品和服务是通过Moomoo Securities Malaysia Sdn. Bhd. 提供,该公司受马来西亚证券监督委员会(SC)监管(牌照号码︰eCMSL/A0397/2024) ,持有资本市场服务牌照 (CMSL) 。本内容未经马来西亚证券监督委员会的审查。
Moomoo Technologies Inc., Moomoo Financial Inc., Moomoo Financial Singapore Pte. Ltd., Futu Securities (Australia) Ltd, Moomoo Financial Canada Inc.,和Moomoo Securities Malaysia Sdn. Bhd.是关联公司。
风险及免责提示
moomoo是Moomoo Technologies Inc.公司提供的金融信息和交易应用程序。
在美国,moomoo上的投资产品和服务由Moomoo Financial Inc.提供,一家受美国证券交易委员会(SEC)监管的持牌主体。 Moomoo Financial Inc.是金融业监管局(FINRA)和证券投资者保护公司(SIPC)的成员。
在新加坡,moomoo上的投资产品和服务是通过Moomoo Financial Singapore Pte. Ltd.提供,该公司受新加坡金融管理局(MAS)监管(牌照号码︰CMS101000) ,持有资本市场服务牌照 (CMS) ,持有财务顾问豁免(Exempt Financial Adviser)资质。本内容未经新加坡金融管理局的审查。
在澳大利亚,moomoo上的金融产品和服务是通过Futu Securities (Australia) Ltd提供,该公司是受澳大利亚证券和投资委员会(ASIC)监管的澳大利亚金融服务许可机构(AFSL No. 224663)。请阅读并理解我们的《金融服务指南》、《条款与条件》、《隐私政策》和其他披露文件,这些文件可在我们的网站 https://www.moomoo.com/au中获取。
在加拿大,通过moomoo应用提供的仅限订单执行的券商服务由Moomoo Financial Canada Inc.提供,并受加拿大投资监管机构(CIRO)监管。
在马来西亚,moomoo上的投资产品和服务是通过Moomoo Securities Malaysia Sdn. Bhd. 提供,该公司受马来西亚证券监督委员会(SC)监管(牌照号码︰eCMSL/A0397/2024) ,持有资本市场服务牌照 (CMSL) 。本内容未经马来西亚证券监督委员会的审查。
Moomoo Technologies Inc., Moomoo Financial Inc., Moomoo Financial Singapore Pte. Ltd., Futu Securities (Australia) Ltd, Moomoo Financial Canada Inc.,和Moomoo Securities Malaysia Sdn. Bhd.是关联公司。
- 分享到weixin
- 分享到qq
- 分享到facebook
- 分享到twitter
- 分享到微博
- 粘贴板
使用浏览器的分享功能,分享给你的好友吧