
-
市场
-
产品
-
资讯
-
Moo社区
-
课堂
-
查看更多
-
功能介绍
-
费用费用透明,无最低余额限制
投资选择、功能介绍、费用相关信息由Moomoo Financial Inc.提供
- English
- 中文繁體
- 中文简体
- 深色
- 浅色
Investors in EVE Energy (SZSE:300014) Have Made a Incredible Return of 856% Over the Past Five Years
Investors in EVE Energy (SZSE:300014) Have Made a Incredible Return of 856% Over the Past Five Years
Buying shares in the best businesses can build meaningful wealth for you and your family. And we've seen some truly amazing gains over the years. Don't believe it? Then look at the EVE Energy Co., Ltd. (SZSE:300014) share price. It's 846% higher than it was five years ago. This just goes to show the value creation that some businesses can achieve. It's also good to see the share price up 14% over the last quarter. We love happy stories like this one. The company should be really proud of that performance!
So let's assess the underlying fundamentals over the last 5 years and see if they've moved in lock-step with shareholder returns.
See our latest analysis for EVE Energy
To quote Buffett, 'Ships will sail around the world but the Flat Earth Society will flourish. There will continue to be wide discrepancies between price and value in the marketplace...' One flawed but reasonable way to assess how sentiment around a company has changed is to compare the earnings per share (EPS) with the share price.
Over half a decade, EVE Energy managed to grow its earnings per share at 56% a year. This EPS growth is remarkably close to the 57% average annual increase in the share price. That suggests that the market sentiment around the company hasn't changed much over that time. Rather, the share price has approximately tracked EPS growth.
You can see how EPS has changed over time in the image below (click on the chart to see the exact values).
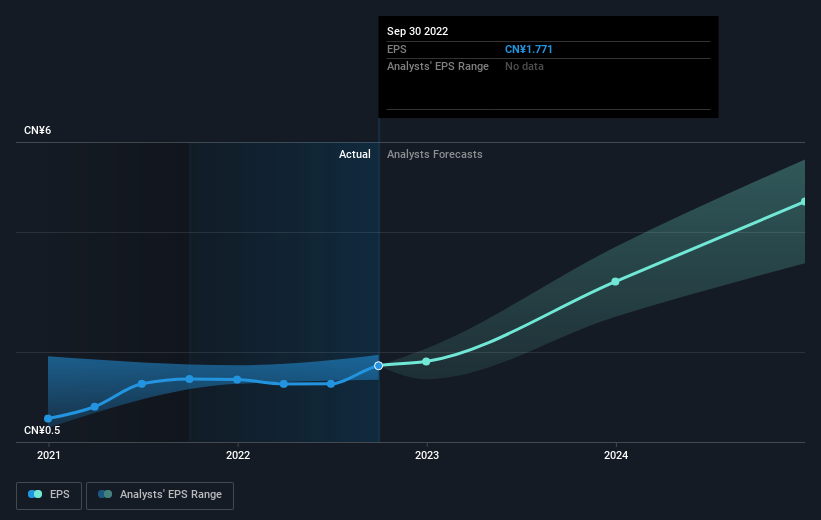 SZSE:300014 Earnings Per Share Growth December 15th 2022
We know that EVE Energy has improved its bottom line lately, but is it going to grow revenue? If you're interested, you could check this free report showing consensus revenue forecasts.
What About Dividends?
It is important to consider the total shareholder return, as well as the share price return, for any given stock. The TSR incorporates the value of any spin-offs or discounted capital raisings, along with any dividends, based on the assumption that the dividends are reinvested. So for companies that pay a generous dividend, the TSR is often a lot higher than the share price return. In the case of EVE Energy, it has a TSR of 856% for the last 5 years. That exceeds its share price return that we previously mentioned. This is largely a result of its dividend payments!
A Different Perspective
We regret to report that EVE Energy shareholders are down 32% for the year (even including dividends). Unfortunately, that's worse than the broader market decline of 17%. Having said that, it's inevitable that some stocks will be oversold in a falling market. The key is to keep your eyes on the fundamental developments. Longer term investors wouldn't be so upset, since they would have made 57%, each year, over five years. If the fundamental data continues to indicate long term sustainable growth, the current sell-off could be an opportunity worth considering. It's always interesting to track share price performance over the longer term. But to understand EVE Energy better, we need to consider many other factors. Like risks, for instance. Every company has them, and we've spotted 4 warning signs for EVE Energy (of which 1 is significant!) you should know about.
If you would prefer to check out another company -- one with potentially superior financials -- then do not miss this free list of companies that have proven they can grow earnings.
Please note, the market returns quoted in this article reflect the market weighted average returns of stocks that currently trade on CN exchanges.
Have feedback on this article? Concerned about the content? Get in touch with us directly. Alternatively, email editorial-team (at) simplywallst.com.
This article by Simply Wall St is general in nature. We provide commentary based on historical data and analyst forecasts only using an unbiased methodology and our articles are not intended to be financial advice. It does not constitute a recommendation to buy or sell any stock, and does not take account of your objectives, or your financial situation. We aim to bring you long-term focused analysis driven by fundamental data. Note that our analysis may not factor in the latest price-sensitive company announcements or qualitative material. Simply Wall St has no position in any stocks mentioned.
购买最佳企业的股票可以为您和您的家人创造有意义的财富。这些年来,我们已经看到了一些真正惊人的成就。不相信?然后看看 亿纬能源有限公司 (深圳证券交易所:300014)的股价。它比五年前高出了 846%。这只是表明某些企业可以实现的价值创造。也很高兴看到股价比上个季度上涨了14%。我们喜欢这样的快乐故事。公司应该为这种表现感到非常自豪!
因此,让我们评估过去5年的基本面,看看它们是否与股东回报步调一致。
查看我们对 EVE Energy 的最新分析
引用巴菲特的话说:“船只将在世界各地航行,但Flat Earth Society将蓬勃发展。市场上的价格和价值之间将继续存在巨大差异...”评估公司情绪变化的一种有缺陷但合理的方法是将每股收益(EPS)与股价进行比较。
在过去的五年中,EVE Energy设法将其每股收益增长到每年56%。每股收益的增长非常接近股价平均每年增长57%。这表明,在这段时间内,公司周围的市场情绪并没有太大变化。相反,股价大约追踪了每股收益的增长。
您可以在下图中看到 EPS 随时间推移的变化(点击图表查看确切值)。
深圳证券交易所:300014 每股收益增长 2022 年 12 月 15 日我们知道EVE Energy最近提高了利润,但它会增加收入吗?如果你有兴趣,你可以看看这个 免费的 显示共识收入预测的报告。
那股息呢?
重要的是要考虑任何给定股票的股东总回报以及股价回报率。TSR纳入了任何分拆或折扣资本筹集的价值以及任何股息,前提是股息是再投资的。因此,对于支付丰厚股息的公司来说,股东总回报率通常远高于股价回报率。就EVE Energy而言,在过去5年中,其股东总回报率为856%。这超过了我们之前提到的股价回报率。这在很大程度上是其支付股息的结果!
不同的视角
我们遗憾地报告,EVE Energy的股东今年下降了32%(甚至包括股息)。不幸的是,这比大盘跌幅17%还要糟糕。话虽如此,在下跌的市场中,一些股票不可避免地会被超卖。关键是要密切关注基本面的事态发展。长期投资者不会那么沮丧,因为他们将在五年内每年赚57%。如果基本面数据继续表明长期可持续增长,那么当前的抛售可能是一个值得考虑的机会。长期跟踪股价表现总是很有趣。但是为了更好地理解 EVE Energy,我们需要考虑许多其他因素。比如说,像风险一样。每家公司都有它们,我们已经发现了 EVE Energy 的 4 个警告信 (其中 1 很重要!)你应该知道。
如果你想去另一家公司看看 —— 一家财务状况可能优异的公司 —— 那千万不要错过这个 免费的 已证明可以增加收益的公司名单。
请注意,本文引用的市场回报反映了目前在CN交易所交易的股票的市场加权平均回报。
对这篇文章有反馈吗?对内容感到担忧? 取得联系 直接和我们联系。 或者,给编辑团队 (at) simplywallst.com 发送电子邮件。
Simply Wall St 的这篇文章本质上是一般性的。 我们仅使用不偏不倚的方法根据历史数据和分析师预测提供评论,我们的文章并非旨在提供财务建议。 它不构成买入或卖出任何股票的建议,也没有考虑您的目标或财务状况。我们的目标是为您提供由基本面数据驱动的长期重点分析。请注意,我们的分析可能未将最新的价格敏感型公司公告或定性材料考虑在内。简而言之,华尔街对上述任何股票都没有头寸。
moomoo是Moomoo Technologies Inc.公司提供的金融信息和交易应用程序。
在美国,moomoo上的投资产品和服务由Moomoo Financial Inc.提供,一家受美国证券交易委员会(SEC)监管的持牌主体。 Moomoo Financial Inc.是金融业监管局(FINRA)和证券投资者保护公司(SIPC)的成员。
在新加坡,moomoo上的投资产品和服务是通过Moomoo Financial Singapore Pte. Ltd.提供,该公司受新加坡金融管理局(MAS)监管(牌照号码︰CMS101000) ,持有资本市场服务牌照 (CMS) ,持有财务顾问豁免(Exempt Financial Adviser)资质。本内容未经新加坡金融管理局的审查。
在澳大利亚,moomoo上的金融产品和服务是通过Futu Securities (Australia) Ltd提供,该公司是受澳大利亚证券和投资委员会(ASIC)监管的澳大利亚金融服务许可机构(AFSL No. 224663)。请阅读并理解我们的《金融服务指南》、《条款与条件》、《隐私政策》和其他披露文件,这些文件可在我们的网站 https://www.moomoo.com/au中获取。
在加拿大,通过moomoo应用提供的仅限订单执行的券商服务由Moomoo Financial Canada Inc.提供,并受加拿大投资监管机构(CIRO)监管。
在马来西亚,moomoo上的投资产品和服务是通过Moomoo Securities Malaysia Sdn. Bhd. 提供,该公司受马来西亚证券监督委员会(SC)监管(牌照号码︰eCMSL/A0397/2024) ,持有资本市场服务牌照 (CMSL) 。本内容未经马来西亚证券监督委员会的审查。
Moomoo Technologies Inc., Moomoo Financial Inc., Moomoo Financial Singapore Pte. Ltd., Futu Securities (Australia) Ltd, Moomoo Financial Canada Inc.,和Moomoo Securities Malaysia Sdn. Bhd.是关联公司。
风险及免责提示
moomoo是Moomoo Technologies Inc.公司提供的金融信息和交易应用程序。
在美国,moomoo上的投资产品和服务由Moomoo Financial Inc.提供,一家受美国证券交易委员会(SEC)监管的持牌主体。 Moomoo Financial Inc.是金融业监管局(FINRA)和证券投资者保护公司(SIPC)的成员。
在新加坡,moomoo上的投资产品和服务是通过Moomoo Financial Singapore Pte. Ltd.提供,该公司受新加坡金融管理局(MAS)监管(牌照号码︰CMS101000) ,持有资本市场服务牌照 (CMS) ,持有财务顾问豁免(Exempt Financial Adviser)资质。本内容未经新加坡金融管理局的审查。
在澳大利亚,moomoo上的金融产品和服务是通过Futu Securities (Australia) Ltd提供,该公司是受澳大利亚证券和投资委员会(ASIC)监管的澳大利亚金融服务许可机构(AFSL No. 224663)。请阅读并理解我们的《金融服务指南》、《条款与条件》、《隐私政策》和其他披露文件,这些文件可在我们的网站 https://www.moomoo.com/au中获取。
在加拿大,通过moomoo应用提供的仅限订单执行的券商服务由Moomoo Financial Canada Inc.提供,并受加拿大投资监管机构(CIRO)监管。
在马来西亚,moomoo上的投资产品和服务是通过Moomoo Securities Malaysia Sdn. Bhd. 提供,该公司受马来西亚证券监督委员会(SC)监管(牌照号码︰eCMSL/A0397/2024) ,持有资本市场服务牌照 (CMSL) 。本内容未经马来西亚证券监督委员会的审查。
Moomoo Technologies Inc., Moomoo Financial Inc., Moomoo Financial Singapore Pte. Ltd., Futu Securities (Australia) Ltd, Moomoo Financial Canada Inc.,和Moomoo Securities Malaysia Sdn. Bhd.是关联公司。
- 分享到weixin
- 分享到qq
- 分享到facebook
- 分享到twitter
- 分享到微博
- 粘贴板
使用浏览器的分享功能,分享给你的好友吧