
-
市场
-
产品
-
资讯
-
Moo社区
-
课堂
-
查看更多
-
功能介绍
-
费用费用透明,无最低余额限制
投资选择、功能介绍、费用相关信息由Moomoo Financial Inc.提供
- English
- 中文繁體
- 中文简体
- 深色
- 浅色
Investors Three-year Losses Continue as GrafTech International (NYSE:EAF) Dips a Further 7.8% This Week, Earnings Continue to Decline
Investors Three-year Losses Continue as GrafTech International (NYSE:EAF) Dips a Further 7.8% This Week, Earnings Continue to Decline
If you love investing in stocks you're bound to buy some losers. But the last three years have been particularly tough on longer term GrafTech International Ltd. (NYSE:EAF) shareholders. Sadly for them, the share price is down 65% in that time. The more recent news is of little comfort, with the share price down 61% in a year. Furthermore, it's down 39% in about a quarter. That's not much fun for holders.
Given the past week has been tough on shareholders, let's investigate the fundamentals and see what we can learn.
View our latest analysis for GrafTech International
While markets are a powerful pricing mechanism, share prices reflect investor sentiment, not just underlying business performance. One flawed but reasonable way to assess how sentiment around a company has changed is to compare the earnings per share (EPS) with the share price.
During the three years that the share price fell, GrafTech International's earnings per share (EPS) dropped by 12% each year. This reduction in EPS is slower than the 30% annual reduction in the share price. So it seems the market was too confident about the business, in the past. This increased caution is also evident in the rather low P/E ratio, which is sitting at 2.19.
You can see below how EPS has changed over time (discover the exact values by clicking on the image).
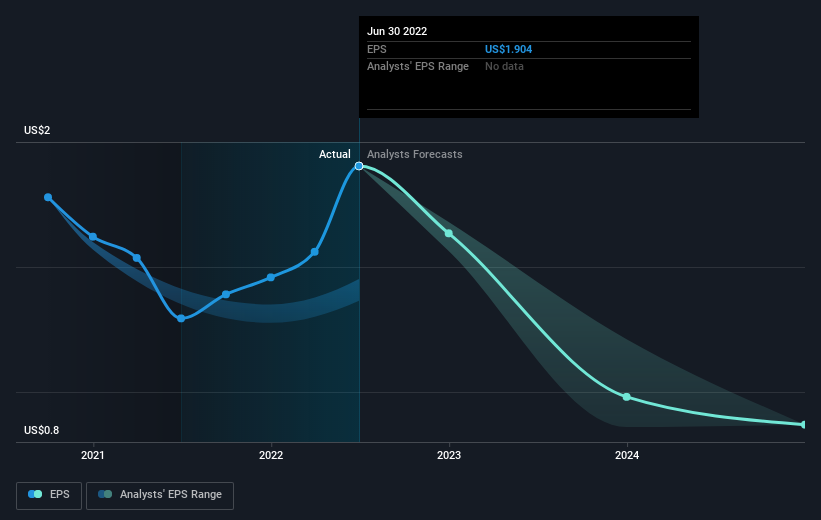 NYSE:EAF Earnings Per Share Growth September 29th 2022
We like that insiders have been buying shares in the last twelve months. Even so, future earnings will be far more important to whether current shareholders make money. Dive deeper into the earnings by checking this interactive graph of GrafTech International's earnings, revenue and cash flow.
A Different Perspective
The last twelve months weren't great for GrafTech International shares, which performed worse than the market, costing holders 60%, including dividends. The market shed around 19%, no doubt weighing on the stock price. Shareholders have lost 18% per year over the last three years, so the share price drop has become steeper, over the last year; a potential symptom of as yet unsolved challenges. We would be wary of buying into a company with unsolved problems, although some investors will buy into struggling stocks if they believe the price is sufficiently attractive. It's always interesting to track share price performance over the longer term. But to understand GrafTech International better, we need to consider many other factors. Consider for instance, the ever-present spectre of investment risk. We've identified 2 warning signs with GrafTech International (at least 1 which is potentially serious) , and understanding them should be part of your investment process.
There are plenty of other companies that have insiders buying up shares. You probably do not want to miss this free list of growing companies that insiders are buying.
Please note, the market returns quoted in this article reflect the market weighted average returns of stocks that currently trade on US exchanges.
Have feedback on this article? Concerned about the content? Get in touch with us directly. Alternatively, email editorial-team (at) simplywallst.com.
This article by Simply Wall St is general in nature. We provide commentary based on historical data and analyst forecasts only using an unbiased methodology and our articles are not intended to be financial advice. It does not constitute a recommendation to buy or sell any stock, and does not take account of your objectives, or your financial situation. We aim to bring you long-term focused analysis driven by fundamental data. Note that our analysis may not factor in the latest price-sensitive company announcements or qualitative material. Simply Wall St has no position in any stocks mentioned.
如果你喜欢投资股票,你一定会买一些失败者。但过去三年对长期而言尤其艰难。GrafTech国际有限公司(纽约证券交易所代码:EAF)股东。对他们来说,可悲的是,股价在这段时间里下跌了65%。最近的消息并不令人欣慰,该公司股价在一年内下跌了61%。此外,它在大约一个季度内下跌了39%。对于持有者来说,这并不是什么乐趣。
鉴于过去一周对股东的态度一直很严峻,让我们调查一下基本面,看看我们能学到什么。
查看我们对GrafTech International的最新分析
虽然市场是一种强大的定价机制,但股价反映的是投资者情绪,而不仅仅是潜在的企业表现。评估围绕一家公司的情绪变化的一个有缺陷但合理的方法是将每股收益(EPS)与股价进行比较。
在股价下跌的三年中,GrafTech International的每股收益(EPS)每年下降12%。每股收益的这一降幅比股价每年30%的降幅要慢。因此,过去市场似乎对这项业务过于自信。这种更加谨慎的态度也明显体现在相当低的市盈率上,目前为2.19倍。
您可以在下面看到EPS是如何随着时间的推移而变化的(通过单击图像来了解确切的值)。
纽约证券交易所:EAF每股收益增长2022年9月29日我们喜欢的是,内部人士在过去12个月一直在买入股票。即便如此,未来的收益对现有股东是否赚钱将重要得多。通过查看GrafTech International的收益、收入和现金流的互动图表,更深入地了解收益。
不同的视角
过去12个月对GrafTech International的股票来说并不好,该股的表现逊于大盘,持股者损失了60%,其中包括股息。股市下跌了约19%,无疑拖累了股价。股东在过去三年里每年损失18%,因此股价在过去一年里跌幅变得更大;这是尚未解决的挑战的潜在症状。我们会对买入一家问题尚未解决的公司持谨慎态度,尽管一些投资者如果认为价格足够有吸引力,就会买入陷入困境的股票。跟踪股价的长期表现总是很有趣的。但为了更好地了解GrafTech International,我们需要考虑许多其他因素。例如,考虑一下无处不在的投资风险幽灵。我们已经确定了两个警告信号与GrafTech International合作(至少1个可能是严重的),了解他们应该是你投资过程的一部分。
还有很多其他公司让内部人士买进股票。你很可能会这么做不想怀念这一切吗?免费内部人士正在收购的成长型公司名单。
请注意,本文引用的市场回报反映了目前在美国交易所交易的股票的市场加权平均回报。
对这篇文章有什么反馈吗?担心内容吗? 保持联系直接与我们联系。或者,也可以给编辑组发电子邮件,地址是implywallst.com。
本文由Simply Wall St.撰写,具有概括性。我们仅使用不偏不倚的方法提供基于历史数据和分析师预测的评论,我们的文章并不打算作为财务建议。它不构成买卖任何股票的建议,也没有考虑你的目标或你的财务状况。我们的目标是为您带来由基本面数据驱动的长期重点分析。请注意,我们的分析可能不会将最新的对价格敏感的公司公告或定性材料考虑在内。Simply Wall St.对上述任何一只股票都没有持仓。
moomoo是Moomoo Technologies Inc.公司提供的金融信息和交易应用程序。
在美国,moomoo上的投资产品和服务由Moomoo Financial Inc.提供,一家受美国证券交易委员会(SEC)监管的持牌主体。 Moomoo Financial Inc.是金融业监管局(FINRA)和证券投资者保护公司(SIPC)的成员。
在新加坡,moomoo上的投资产品和服务是通过Moomoo Financial Singapore Pte. Ltd.提供,该公司受新加坡金融管理局(MAS)监管(牌照号码︰CMS101000) ,持有资本市场服务牌照 (CMS) ,持有财务顾问豁免(Exempt Financial Adviser)资质。本内容未经新加坡金融管理局的审查。
在澳大利亚,moomoo上的金融产品和服务是通过Futu Securities (Australia) Ltd提供,该公司是受澳大利亚证券和投资委员会(ASIC)监管的澳大利亚金融服务许可机构(AFSL No. 224663)。请阅读并理解我们的《金融服务指南》、《条款与条件》、《隐私政策》和其他披露文件,这些文件可在我们的网站 https://www.moomoo.com/au中获取。
在加拿大,通过moomoo应用提供的仅限订单执行的券商服务由Moomoo Financial Canada Inc.提供,并受加拿大投资监管机构(CIRO)监管。
在马来西亚,moomoo上的投资产品和服务是通过Moomoo Securities Malaysia Sdn. Bhd. 提供,该公司受马来西亚证券监督委员会(SC)监管(牌照号码︰eCMSL/A0397/2024) ,持有资本市场服务牌照 (CMSL) 。本内容未经马来西亚证券监督委员会的审查。
Moomoo Technologies Inc., Moomoo Financial Inc., Moomoo Financial Singapore Pte. Ltd., Futu Securities (Australia) Ltd, Moomoo Financial Canada Inc.,和Moomoo Securities Malaysia Sdn. Bhd.是关联公司。
风险及免责提示
moomoo是Moomoo Technologies Inc.公司提供的金融信息和交易应用程序。
在美国,moomoo上的投资产品和服务由Moomoo Financial Inc.提供,一家受美国证券交易委员会(SEC)监管的持牌主体。 Moomoo Financial Inc.是金融业监管局(FINRA)和证券投资者保护公司(SIPC)的成员。
在新加坡,moomoo上的投资产品和服务是通过Moomoo Financial Singapore Pte. Ltd.提供,该公司受新加坡金融管理局(MAS)监管(牌照号码︰CMS101000) ,持有资本市场服务牌照 (CMS) ,持有财务顾问豁免(Exempt Financial Adviser)资质。本内容未经新加坡金融管理局的审查。
在澳大利亚,moomoo上的金融产品和服务是通过Futu Securities (Australia) Ltd提供,该公司是受澳大利亚证券和投资委员会(ASIC)监管的澳大利亚金融服务许可机构(AFSL No. 224663)。请阅读并理解我们的《金融服务指南》、《条款与条件》、《隐私政策》和其他披露文件,这些文件可在我们的网站 https://www.moomoo.com/au中获取。
在加拿大,通过moomoo应用提供的仅限订单执行的券商服务由Moomoo Financial Canada Inc.提供,并受加拿大投资监管机构(CIRO)监管。
在马来西亚,moomoo上的投资产品和服务是通过Moomoo Securities Malaysia Sdn. Bhd. 提供,该公司受马来西亚证券监督委员会(SC)监管(牌照号码︰eCMSL/A0397/2024) ,持有资本市场服务牌照 (CMSL) 。本内容未经马来西亚证券监督委员会的审查。
Moomoo Technologies Inc., Moomoo Financial Inc., Moomoo Financial Singapore Pte. Ltd., Futu Securities (Australia) Ltd, Moomoo Financial Canada Inc.,和Moomoo Securities Malaysia Sdn. Bhd.是关联公司。
- 分享到weixin
- 分享到qq
- 分享到facebook
- 分享到twitter
- 分享到微博
- 粘贴板
使用浏览器的分享功能,分享给你的好友吧