
-
市场
-
产品
-
资讯
-
Moo社区
-
课堂
-
查看更多
-
功能介绍
-
费用费用透明,无最低余额限制
投资选择、功能介绍、费用相关信息由Moomoo Financial Inc.提供
- English
- 中文繁體
- 中文简体
- 深色
- 浅色
The TJX Companies, Inc. (NYSE:TJX) Shares Could Be 44% Below Their Intrinsic Value Estimate
The TJX Companies, Inc. (NYSE:TJX) Shares Could Be 44% Below Their Intrinsic Value Estimate
How far off is The TJX Companies, Inc. (NYSE:TJX) from its intrinsic value? Using the most recent financial data, we'll take a look at whether the stock is fairly priced by projecting its future cash flows and then discounting them to today's value. This will be done using the Discounted Cash Flow (DCF) model. Believe it or not, it's not too difficult to follow, as you'll see from our example!
We would caution that there are many ways of valuing a company and, like the DCF, each technique has advantages and disadvantages in certain scenarios. Anyone interested in learning a bit more about intrinsic value should have a read of the Simply Wall St analysis model.
View our latest analysis for TJX Companies
Is TJX Companies Fairly Valued?
We use what is known as a 2-stage model, which simply means we have two different periods of growth rates for the company's cash flows. Generally the first stage is higher growth, and the second stage is a lower growth phase. In the first stage we need to estimate the cash flows to the business over the next ten years. Where possible we use analyst estimates, but when these aren't available we extrapolate the previous free cash flow (FCF) from the last estimate or reported value. We assume companies with shrinking free cash flow will slow their rate of shrinkage, and that companies with growing free cash flow will see their growth rate slow, over this period. We do this to reflect that growth tends to slow more in the early years than it does in later years.
Generally we assume that a dollar today is more valuable than a dollar in the future, and so the sum of these future cash flows is then discounted to today's value:
10-year free cash flow (FCF) estimate
| 2023 | 2024 | 2025 | 2026 | 2027 | 2028 | 2029 | 2030 | 2031 | 2032 | |
| Levered FCF ($, Millions) | US$2.30b | US$3.19b | US$4.13b | US$3.87b | US$5.34b | US$5.94b | US$6.43b | US$6.84b | US$7.19b | US$7.49b |
| Growth Rate Estimate Source | Analyst x7 | Analyst x7 | Analyst x4 | Analyst x3 | Analyst x3 | Est @ 11.08% | Est @ 8.34% | Est @ 6.42% | Est @ 5.08% | Est @ 4.14% |
| Present Value ($, Millions) Discounted @ 6.4% | US$2.2k | US$2.8k | US$3.4k | US$3.0k | US$3.9k | US$4.1k | US$4.2k | US$4.2k | US$4.1k | US$4.0k |
("Est" = FCF growth rate estimated by Simply Wall St)
Present Value of 10-year Cash Flow (PVCF) = US$36b
The second stage is also known as Terminal Value, this is the business's cash flow after the first stage. The Gordon Growth formula is used to calculate Terminal Value at a future annual growth rate equal to the 5-year average of the 10-year government bond yield of 1.9%. We discount the terminal cash flows to today's value at a cost of equity of 6.4%.
Terminal Value (TV)= FCF2032 × (1 + g) ÷ (r – g) = US$7.5b× (1 + 1.9%) ÷ (6.4%– 1.9%) = US$171b
Present Value of Terminal Value (PVTV)= TV / (1 + r)10= US$171b÷ ( 1 + 6.4%)10= US$92b
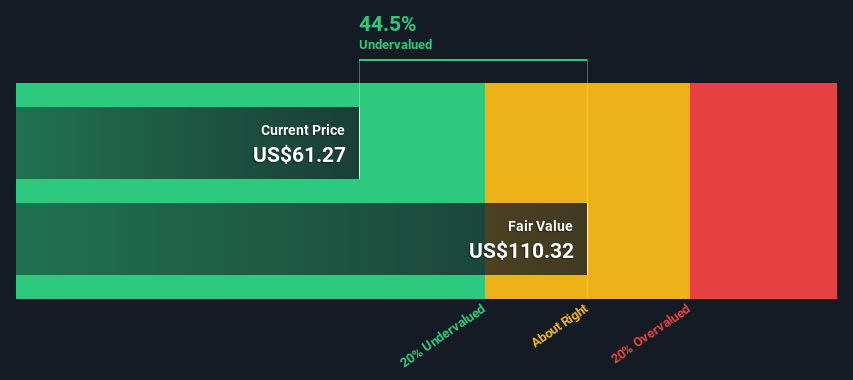
The total value, or equity value, is then the sum of the present value of the future cash flows, which in this case is US$128b. To get the intrinsic value per share, we divide this by the total number of shares outstanding. Relative to the current share price of US$61.3, the company appears quite undervalued at a 44% discount to where the stock price trades currently. Remember though, that this is just an approximate valuation, and like any complex formula - garbage in, garbage out.
 NYSE:TJX Discounted Cash Flow September 26th 2022
Important Assumptions
We would point out that the most important inputs to a discounted cash flow are the discount rate and of course the actual cash flows. Part of investing is coming up with your own evaluation of a company's future performance, so try the calculation yourself and check your own assumptions. The DCF also does not consider the possible cyclicality of an industry, or a company's future capital requirements, so it does not give a full picture of a company's potential performance. Given that we are looking at TJX Companies as potential shareholders, the cost of equity is used as the discount rate, rather than the cost of capital (or weighted average cost of capital, WACC) which accounts for debt. In this calculation we've used 6.4%, which is based on a levered beta of 1.051. Beta is a measure of a stock's volatility, compared to the market as a whole. We get our beta from the industry average beta of globally comparable companies, with an imposed limit between 0.8 and 2.0, which is a reasonable range for a stable business.
Next Steps:
Whilst important, the DCF calculation ideally won't be the sole piece of analysis you scrutinize for a company. DCF models are not the be-all and end-all of investment valuation. Preferably you'd apply different cases and assumptions and see how they would impact the company's valuation. For instance, if the terminal value growth rate is adjusted slightly, it can dramatically alter the overall result. Can we work out why the company is trading at a discount to intrinsic value? For TJX Companies, there are three pertinent elements you should consider:
- Risks: As an example, we've found 3 warning signs for TJX Companies (1 makes us a bit uncomfortable!) that you need to consider before investing here.
- Management:Have insiders been ramping up their shares to take advantage of the market's sentiment for TJX's future outlook? Check out our management and board analysis with insights on CEO compensation and governance factors.
- Other High Quality Alternatives: Do you like a good all-rounder? Explore our interactive list of high quality stocks to get an idea of what else is out there you may be missing!
PS. The Simply Wall St app conducts a discounted cash flow valuation for every stock on the NYSE every day. If you want to find the calculation for other stocks just search here.
Have feedback on this article? Concerned about the content? Get in touch with us directly. Alternatively, email editorial-team (at) simplywallst.com.
This article by Simply Wall St is general in nature. We provide commentary based on historical data and analyst forecasts only using an unbiased methodology and our articles are not intended to be financial advice. It does not constitute a recommendation to buy or sell any stock, and does not take account of your objectives, or your financial situation. We aim to bring you long-term focused analysis driven by fundamental data. Note that our analysis may not factor in the latest price-sensitive company announcements or qualitative material. Simply Wall St has no position in any stocks mentioned.
TJX Companies,Inc.(纽约证券交易所代码:TJX)距离其内在价值还有多远?使用最新的财务数据,我们将通过预测未来的现金流,然后将其贴现到今天的价值,来看看股票的定价是否公平。这将使用贴现现金流(DCF)模型来实现。信不信由你,遵循它并不太难,正如您将从我们的示例中看到的那样!
我们要提醒的是,对一家公司进行估值的方法有很多种,与贴现现金流一样,每种方法在某些情况下都有优缺点。任何有兴趣了解更多内在价值的人,都应该阅读一下Simply Wall St.的分析模型。
查看我们对TJX公司的最新分析
TJX公司的估值公平吗?
我们使用所谓的两阶段模型,也就是说,公司的现金流有两个不同的增长率。一般来说,第一阶段是较高增长阶段,第二阶段是较低增长阶段。在第一阶段,我们需要估计未来十年为企业带来的现金流。在可能的情况下,我们使用分析师的估计,但当这些估计不可用时,我们会根据上次估计或报告的价值推断先前的自由现金流(FCF)。我们假设,自由现金流萎缩的公司将减缓收缩速度,而自由现金流增长的公司在这段时间内的增长速度将放缓。我们这样做是为了反映出,增长在最初几年往往比后来几年放缓得更多。
一般来说,我们假设今天的一美元比未来的一美元更有价值,所以这些未来现金流的总和就会贴现到今天的价值:
10年自由现金流(FCF)估计
| 2023 | 2024 | 2025 | 2026 | 2027 | 2028 | 2029 | 2030 | 2031 | 2032 | |
| 杠杆式FCF(百万美元) | 23亿美元 | 31.9亿美元 | 41.3亿美元 | 38.7亿美元 | 53.4亿美元 | 59.4亿美元 | 64.3亿美元 | 68.4亿美元 | 71.9亿美元 | 74.9亿美元 |
| 增长率预估来源 | 分析师x7 | 分析师x7 | 分析师x4 | 分析师x3 | 分析师x3 | Est@11.08% | Est@8.34% | Est@6.42% | Est@5.08% | Est@4.14% |
| 现值(美元,百万)贴现@6.4% | 220万美元 | 280万美元 | 340万美元 | 3万美元 | 390万美元 | 410万美元 | 420万美元 | 420万美元 | 410万美元 | 4万美元 |
(“EST”=Simply Wall St.预估的FCF成长率)
10年期现金流现值(PVCF)=360亿美元
第二阶段也被称为终端价值,这是企业在第一阶段之后的现金流。戈登增长公式用于计算终端价值,其未来年增长率等于10年期政府债券收益率1.9%的5年平均水平。我们以6.4%的权益成本将终端现金流贴现至今天的价值。
终端值(TV)=FCF2032×(1+g)?(r-g)=75亿美元×(1+1.9%)?(6.4%-1.9%)=1710亿美元
终值现值(PVTV)=TV/(1+r)10=1710亿美元?(1+6.4%)10=920亿美元
那么,总价值或股权价值就是未来现金流的现值之和,在这种情况下,现金流为1280亿美元。为了得到每股内在价值,我们将其除以总流通股数量。相对于目前61.3美元的股价,该公司的估值似乎相当低,较目前的股价有44%的折让。不过,请记住,这只是一个大致的估值,就像任何复杂的公式一样--垃圾输入,垃圾输出。
纽约证券交易所:TJX贴现现金流2022年9月26日重要假设
我们要指出,贴现现金流最重要的投入是贴现率,当然还有实际现金流。投资的一部分是你自己对一家公司未来业绩的评估,所以你自己试一试计算,检查你自己的假设。DCF也没有考虑一个行业可能的周期性,也没有考虑一家公司未来的资本要求,因此它没有给出一家公司潜在业绩的全貌。鉴于我们将TJX公司视为潜在股东,股权成本被用作贴现率,而不是占债务的资本成本(或加权平均资本成本,WACC)。在这个计算中,我们使用了6.4%,这是基于杠杆率为1.051的测试值。贝塔系数是衡量一只股票相对于整个市场的波动性的指标。我们的贝塔系数来自全球可比公司的行业平均贝塔系数,强制限制在0.8到2.0之间,这是一个稳定业务的合理范围。
接下来的步骤:
虽然很重要,但理想情况下,贴现现金流计算不会是你为一家公司仔细审查的唯一分析。贴现现金流模型并不是投资估值的全部。你最好应用不同的案例和假设,看看它们会如何影响公司的估值。例如,如果终端价值增长率稍有调整,可能会极大地改变整体结果。我们能弄清楚为什么该公司的股价低于内在价值吗?对于TJX公司,您应该考虑三个相关要素:
- 风险:举个例子,我们发现TJX公司的3个警告信号(1让我们有点不舒服!)你在这里投资之前需要考虑的问题。
- 管理:内部人士是否一直在增持股票,以利用市场对TJX未来前景的情绪?查看我们的管理层和董事会分析,了解对CEO薪酬和治理因素的见解。
- 其他高质量替代产品:你喜欢一个好的全能运动员吗?浏览我们的高质量股票互动列表,了解您可能会错过的其他股票!
PS.Simply Wall St.应用每天对纽约证交所的每只股票进行现金流贴现估值。如果你想找到其他股票的计算方法,只需搜索此处。
对这篇文章有什么反馈吗?担心内容吗? 保持联系直接与我们联系。或者,也可以给编辑组发电子邮件,地址是implywallst.com。
本文由Simply Wall St.撰写,具有概括性。我们仅使用不偏不倚的方法提供基于历史数据和分析师预测的评论,我们的文章并不打算作为财务建议。它不构成买卖任何股票的建议,也没有考虑你的目标或你的财务状况。我们的目标是为您带来由基本面数据驱动的长期重点分析。请注意,我们的分析可能不会将最新的对价格敏感的公司公告或定性材料考虑在内。Simply Wall St.对上述任何一只股票都没有持仓。
moomoo是Moomoo Technologies Inc.公司提供的金融信息和交易应用程序。
在美国,moomoo上的投资产品和服务由Moomoo Financial Inc.提供,一家受美国证券交易委员会(SEC)监管的持牌主体。 Moomoo Financial Inc.是金融业监管局(FINRA)和证券投资者保护公司(SIPC)的成员。
在新加坡,moomoo上的投资产品和服务是通过Moomoo Financial Singapore Pte. Ltd.提供,该公司受新加坡金融管理局(MAS)监管(牌照号码︰CMS101000) ,持有资本市场服务牌照 (CMS) ,持有财务顾问豁免(Exempt Financial Adviser)资质。本内容未经新加坡金融管理局的审查。
在澳大利亚,moomoo上的金融产品和服务是通过Futu Securities (Australia) Ltd提供,该公司是受澳大利亚证券和投资委员会(ASIC)监管的澳大利亚金融服务许可机构(AFSL No. 224663)。请阅读并理解我们的《金融服务指南》、《条款与条件》、《隐私政策》和其他披露文件,这些文件可在我们的网站 https://www.moomoo.com/au中获取。
在加拿大,通过moomoo应用提供的仅限订单执行的券商服务由Moomoo Financial Canada Inc.提供,并受加拿大投资监管机构(CIRO)监管。
在马来西亚,moomoo上的投资产品和服务是通过Moomoo Securities Malaysia Sdn. Bhd. 提供,该公司受马来西亚证券监督委员会(SC)监管(牌照号码︰eCMSL/A0397/2024) ,持有资本市场服务牌照 (CMSL) 。本内容未经马来西亚证券监督委员会的审查。
Moomoo Technologies Inc., Moomoo Financial Inc., Moomoo Financial Singapore Pte. Ltd., Futu Securities (Australia) Ltd, Moomoo Financial Canada Inc.,和Moomoo Securities Malaysia Sdn. Bhd.是关联公司。
风险及免责提示
moomoo是Moomoo Technologies Inc.公司提供的金融信息和交易应用程序。
在美国,moomoo上的投资产品和服务由Moomoo Financial Inc.提供,一家受美国证券交易委员会(SEC)监管的持牌主体。 Moomoo Financial Inc.是金融业监管局(FINRA)和证券投资者保护公司(SIPC)的成员。
在新加坡,moomoo上的投资产品和服务是通过Moomoo Financial Singapore Pte. Ltd.提供,该公司受新加坡金融管理局(MAS)监管(牌照号码︰CMS101000) ,持有资本市场服务牌照 (CMS) ,持有财务顾问豁免(Exempt Financial Adviser)资质。本内容未经新加坡金融管理局的审查。
在澳大利亚,moomoo上的金融产品和服务是通过Futu Securities (Australia) Ltd提供,该公司是受澳大利亚证券和投资委员会(ASIC)监管的澳大利亚金融服务许可机构(AFSL No. 224663)。请阅读并理解我们的《金融服务指南》、《条款与条件》、《隐私政策》和其他披露文件,这些文件可在我们的网站 https://www.moomoo.com/au中获取。
在加拿大,通过moomoo应用提供的仅限订单执行的券商服务由Moomoo Financial Canada Inc.提供,并受加拿大投资监管机构(CIRO)监管。
在马来西亚,moomoo上的投资产品和服务是通过Moomoo Securities Malaysia Sdn. Bhd. 提供,该公司受马来西亚证券监督委员会(SC)监管(牌照号码︰eCMSL/A0397/2024) ,持有资本市场服务牌照 (CMSL) 。本内容未经马来西亚证券监督委员会的审查。
Moomoo Technologies Inc., Moomoo Financial Inc., Moomoo Financial Singapore Pte. Ltd., Futu Securities (Australia) Ltd, Moomoo Financial Canada Inc.,和Moomoo Securities Malaysia Sdn. Bhd.是关联公司。
- 分享到weixin
- 分享到qq
- 分享到facebook
- 分享到twitter
- 分享到微博
- 粘贴板
使用浏览器的分享功能,分享给你的好友吧