
-
市场
-
产品
-
资讯
-
Moo社区
-
课堂
-
查看更多
-
功能介绍
-
费用费用透明,无最低余额限制
投资选择、功能介绍、费用相关信息由Moomoo Financial Inc.提供
- English
- 中文繁體
- 中文简体
- 深色
- 浅色
The Past Three Years for Guangdong Investment (HKG:270) Investors Has Not Been Profitable
The Past Three Years for Guangdong Investment (HKG:270) Investors Has Not Been Profitable
For many investors, the main point of stock picking is to generate higher returns than the overall market. But if you try your hand at stock picking, your risk returning less than the market. Unfortunately, that's been the case for longer term Guangdong Investment Limited (HKG:270) shareholders, since the share price is down 56% in the last three years, falling well short of the market decline of around 4.3%. The more recent news is of little comfort, with the share price down 32% in a year. Furthermore, it's down 23% in about a quarter. That's not much fun for holders. But this could be related to the weak market, which is down 16% in the same period.
It's worthwhile assessing if the company's economics have been moving in lockstep with these underwhelming shareholder returns, or if there is some disparity between the two. So let's do just that.
See our latest analysis for Guangdong Investment
There is no denying that markets are sometimes efficient, but prices do not always reflect underlying business performance. One imperfect but simple way to consider how the market perception of a company has shifted is to compare the change in the earnings per share (EPS) with the share price movement.
Guangdong Investment saw its EPS decline at a compound rate of 1.1% per year, over the last three years. This reduction in EPS is slower than the 24% annual reduction in the share price. So it's likely that the EPS decline has disappointed the market, leaving investors hesitant to buy. This increased caution is also evident in the rather low P/E ratio, which is sitting at 9.14.
The image below shows how EPS has tracked over time (if you click on the image you can see greater detail).
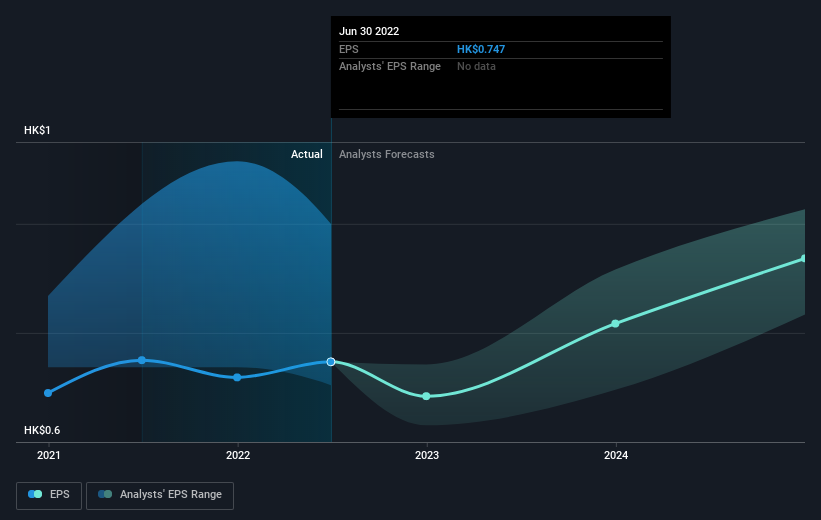 SEHK:270 Earnings Per Share Growth September 25th 2022
Before buying or selling a stock, we always recommend a close examination of historic growth trends, available here.
What About Dividends?
When looking at investment returns, it is important to consider the difference between total shareholder return (TSR) and share price return. The TSR is a return calculation that accounts for the value of cash dividends (assuming that any dividend received was reinvested) and the calculated value of any discounted capital raisings and spin-offs. So for companies that pay a generous dividend, the TSR is often a lot higher than the share price return. In the case of Guangdong Investment, it has a TSR of -48% for the last 3 years. That exceeds its share price return that we previously mentioned. The dividends paid by the company have thusly boosted the total shareholder return.
A Different Perspective
While the broader market lost about 22% in the twelve months, Guangdong Investment shareholders did even worse, losing 28% (even including dividends). However, it could simply be that the share price has been impacted by broader market jitters. It might be worth keeping an eye on the fundamentals, in case there's a good opportunity. Unfortunately, last year's performance may indicate unresolved challenges, given that it was worse than the annualised loss of 4% over the last half decade. Generally speaking long term share price weakness can be a bad sign, though contrarian investors might want to research the stock in hope of a turnaround. It's always interesting to track share price performance over the longer term. But to understand Guangdong Investment better, we need to consider many other factors. Even so, be aware that Guangdong Investment is showing 1 warning sign in our investment analysis , you should know about...
Of course, you might find a fantastic investment by looking elsewhere. So take a peek at this free list of companies we expect will grow earnings.
Please note, the market returns quoted in this article reflect the market weighted average returns of stocks that currently trade on HK exchanges.
Have feedback on this article? Concerned about the content? Get in touch with us directly. Alternatively, email editorial-team (at) simplywallst.com.
This article by Simply Wall St is general in nature. We provide commentary based on historical data and analyst forecasts only using an unbiased methodology and our articles are not intended to be financial advice. It does not constitute a recommendation to buy or sell any stock, and does not take account of your objectives, or your financial situation. We aim to bring you long-term focused analysis driven by fundamental data. Note that our analysis may not factor in the latest price-sensitive company announcements or qualitative material. Simply Wall St has no position in any stocks mentioned.
对于许多投资者来说,选股的主要着眼点是产生高于整体市场的回报。但如果你试着选股,你的风险回报就会低于市场。不幸的是,从长远来看,情况就是这样粤海投资有限公司(HKG:270)股东,因为股价在过去三年下跌56%,远低于约4.3%的市场跌幅。最近的消息并不令人欣慰,该公司股价在一年内下跌了32%。此外,它在大约四分之一的时间里下跌了23%。对于持有者来说,这并不是什么乐趣。但这可能与疲软的市场有关,同期市场下跌了16%。
值得评估的是,该公司的经济状况是否一直与这些平淡无奇的股东回报同步,或者两者之间是否存在一些差距。所以我们就这么做吧。
参见我们对粤海投资的最新分析
不可否认,市场有时是有效的,但价格并不总是反映潜在的商业表现。一种不完美但简单的方法来考虑市场对一家公司的看法是如何改变的,那就是将每股收益(EPS)的变化与股价走势进行比较。
过去三年,粤海投资的每股收益以每年1.1%的复合速度下降。每股收益的这一下降速度慢于该公司股价每年24%的降幅。因此,很可能是每股收益的下降令市场失望,让投资者对买入犹豫不决。这种更加谨慎的态度也明显体现在相当低的市盈率上,目前为9.14倍。
下图显示了EPS是如何随着时间的推移进行跟踪的(如果您点击该图像,您可以看到更多详细信息)。
联交所:270每股盈利增长2022年9月25日在买卖股票之前,我们总是建议仔细研究一下历史增长趋势,可以在这里找到。
那股息呢?
在考察投资回报时,重要的是要考虑到股东总回报(TSR)和股价回报。TSR是一种回报计算,计入了现金股息的价值(假设收到的任何股息都进行了再投资),以及任何贴现融资和剥离的计算价值。因此,对于支付丰厚股息的公司来说,TSR往往比股价回报高得多。以粤海投资为例,过去3年的总资产收益率为-48%。这超过了我们之前提到的它的股价回报。该公司支付的股息因此提振了总计股东回报。
不同的视角
虽然大盘在过去12个月里损失了约22%,但粤海投资股东的表现更糟,损失了28%(甚至包括股息)。然而,这可能只是因为股价受到了更广泛的市场紧张情绪的影响。也许有必要关注基本面,以防出现良机。不幸的是,去年的表现可能预示着尚未解决的挑战,因为它比过去五年4%的年化损失更糟糕。一般来说,股价长期疲软可能是一个坏信号,尽管反向投资者可能会希望研究这只股票,希望它能好转。跟踪股价的长期表现总是很有趣的。但要更好地理解粤海投资,我们还需要考虑许多其他因素。即便如此,要知道粤海投资正在展示在我们的投资分析中出现1个警告信号,你应该知道关于……
当然了,如果你把目光投向别处,你可能会发现这是一笔很棒的投资。所以让我们来看看这个免费我们预计收益将会增长的公司名单。
请注意,本文引用的市场回报反映了目前在香港交易所交易的股票的市场加权平均回报。
对这篇文章有什么反馈吗?担心内容吗? 保持联系直接与我们联系。或者,也可以给编辑组发电子邮件,地址是implywallst.com。
本文由Simply Wall St.撰写,具有概括性。我们仅使用不偏不倚的方法提供基于历史数据和分析师预测的评论,我们的文章并不打算作为财务建议。它不构成买卖任何股票的建议,也没有考虑你的目标或你的财务状况。我们的目标是为您带来由基本面数据驱动的长期重点分析。请注意,我们的分析可能不会将最新的对价格敏感的公司公告或定性材料考虑在内。Simply Wall St.对上述任何一只股票都没有持仓。
moomoo是Moomoo Technologies Inc.公司提供的金融信息和交易应用程序。
在美国,moomoo上的投资产品和服务由Moomoo Financial Inc.提供,一家受美国证券交易委员会(SEC)监管的持牌主体。 Moomoo Financial Inc.是金融业监管局(FINRA)和证券投资者保护公司(SIPC)的成员。
在新加坡,moomoo上的投资产品和服务是通过Moomoo Financial Singapore Pte. Ltd.提供,该公司受新加坡金融管理局(MAS)监管(牌照号码︰CMS101000) ,持有资本市场服务牌照 (CMS) ,持有财务顾问豁免(Exempt Financial Adviser)资质。本内容未经新加坡金融管理局的审查。
在澳大利亚,moomoo上的金融产品和服务是通过Futu Securities (Australia) Ltd提供,该公司是受澳大利亚证券和投资委员会(ASIC)监管的澳大利亚金融服务许可机构(AFSL No. 224663)。请阅读并理解我们的《金融服务指南》、《条款与条件》、《隐私政策》和其他披露文件,这些文件可在我们的网站 https://www.moomoo.com/au中获取。
在加拿大,通过moomoo应用提供的仅限订单执行的券商服务由Moomoo Financial Canada Inc.提供,并受加拿大投资监管机构(CIRO)监管。
在马来西亚,moomoo上的投资产品和服务是通过Moomoo Securities Malaysia Sdn. Bhd. 提供,该公司受马来西亚证券监督委员会(SC)监管(牌照号码︰eCMSL/A0397/2024) ,持有资本市场服务牌照 (CMSL) 。本内容未经马来西亚证券监督委员会的审查。
Moomoo Technologies Inc., Moomoo Financial Inc., Moomoo Financial Singapore Pte. Ltd., Futu Securities (Australia) Ltd, Moomoo Financial Canada Inc.,和Moomoo Securities Malaysia Sdn. Bhd.是关联公司。
风险及免责提示
moomoo是Moomoo Technologies Inc.公司提供的金融信息和交易应用程序。
在美国,moomoo上的投资产品和服务由Moomoo Financial Inc.提供,一家受美国证券交易委员会(SEC)监管的持牌主体。 Moomoo Financial Inc.是金融业监管局(FINRA)和证券投资者保护公司(SIPC)的成员。
在新加坡,moomoo上的投资产品和服务是通过Moomoo Financial Singapore Pte. Ltd.提供,该公司受新加坡金融管理局(MAS)监管(牌照号码︰CMS101000) ,持有资本市场服务牌照 (CMS) ,持有财务顾问豁免(Exempt Financial Adviser)资质。本内容未经新加坡金融管理局的审查。
在澳大利亚,moomoo上的金融产品和服务是通过Futu Securities (Australia) Ltd提供,该公司是受澳大利亚证券和投资委员会(ASIC)监管的澳大利亚金融服务许可机构(AFSL No. 224663)。请阅读并理解我们的《金融服务指南》、《条款与条件》、《隐私政策》和其他披露文件,这些文件可在我们的网站 https://www.moomoo.com/au中获取。
在加拿大,通过moomoo应用提供的仅限订单执行的券商服务由Moomoo Financial Canada Inc.提供,并受加拿大投资监管机构(CIRO)监管。
在马来西亚,moomoo上的投资产品和服务是通过Moomoo Securities Malaysia Sdn. Bhd. 提供,该公司受马来西亚证券监督委员会(SC)监管(牌照号码︰eCMSL/A0397/2024) ,持有资本市场服务牌照 (CMSL) 。本内容未经马来西亚证券监督委员会的审查。
Moomoo Technologies Inc., Moomoo Financial Inc., Moomoo Financial Singapore Pte. Ltd., Futu Securities (Australia) Ltd, Moomoo Financial Canada Inc.,和Moomoo Securities Malaysia Sdn. Bhd.是关联公司。
- 分享到weixin
- 分享到qq
- 分享到facebook
- 分享到twitter
- 分享到微博
- 粘贴板
使用浏览器的分享功能,分享给你的好友吧