
-
市场
-
产品
-
资讯
-
Moo社区
-
课堂
-
查看更多
-
功能介绍
-
费用费用透明,无最低余额限制
投资选择、功能介绍、费用相关信息由Moomoo Financial Inc.提供
- English
- 中文繁體
- 中文简体
- 深色
- 浅色
Declining Stock and Decent Financials: Is The Market Wrong About Dongyue Group Limited (HKG:189)?
Declining Stock and Decent Financials: Is The Market Wrong About Dongyue Group Limited (HKG:189)?
It is hard to get excited after looking at Dongyue Group's (HKG:189) recent performance, when its stock has declined 19% over the past three months. But if you pay close attention, you might find that its key financial indicators look quite decent, which could mean that the stock could potentially rise in the long-term given how markets usually reward more resilient long-term fundamentals. Specifically, we decided to study Dongyue Group's ROE in this article.
Return on equity or ROE is an important factor to be considered by a shareholder because it tells them how effectively their capital is being reinvested. Put another way, it reveals the company's success at turning shareholder investments into profits.
See our latest analysis for Dongyue Group
How Is ROE Calculated?
Return on equity can be calculated by using the formula:
Return on Equity = Net Profit (from continuing operations) ÷ Shareholders' Equity
So, based on the above formula, the ROE for Dongyue Group is:
23% = CN¥3.9b ÷ CN¥17b (Based on the trailing twelve months to June 2022).
The 'return' is the income the business earned over the last year. Another way to think of that is that for every HK$1 worth of equity, the company was able to earn HK$0.23 in profit.
Why Is ROE Important For Earnings Growth?
We have already established that ROE serves as an efficient profit-generating gauge for a company's future earnings. We now need to evaluate how much profit the company reinvests or "retains" for future growth which then gives us an idea about the growth potential of the company. Assuming all else is equal, companies that have both a higher return on equity and higher profit retention are usually the ones that have a higher growth rate when compared to companies that don't have the same features.
A Side By Side comparison of Dongyue Group's Earnings Growth And 23% ROE
Firstly, we acknowledge that Dongyue Group has a significantly high ROE. Second, a comparison with the average ROE reported by the industry of 13% also doesn't go unnoticed by us. However, for some reason, the higher returns aren't reflected in Dongyue Group's meagre five year net income growth average of 3.8%. This is interesting as the high returns should mean that the company has the ability to generate high growth but for some reason, it hasn't been able to do so. Such a scenario is likely to take place when a company pays out a huge portion of its earnings as dividends, or is faced with competitive pressures.
Next, on comparing with the industry net income growth, we found that Dongyue Group's reported growth was lower than the industry growth of 18% in the same period, which is not something we like to see.
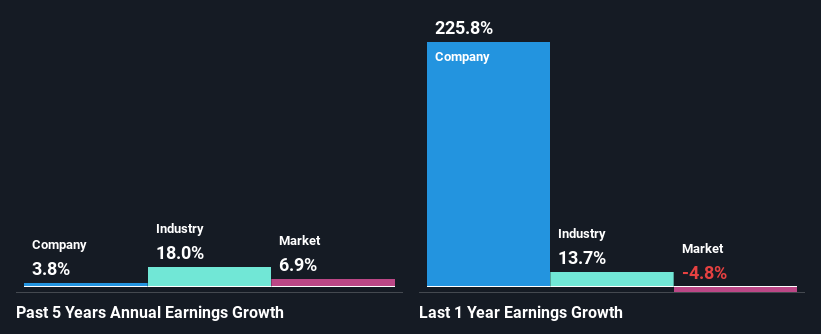 SEHK:189 Past Earnings Growth September 21st 2022
Earnings growth is a huge factor in stock valuation. What investors need to determine next is if the expected earnings growth, or the lack of it, is already built into the share price. This then helps them determine if the stock is placed for a bright or bleak future. One good indicator of expected earnings growth is the P/E ratio which determines the price the market is willing to pay for a stock based on its earnings prospects. So, you may want to check if Dongyue Group is trading on a high P/E or a low P/E, relative to its industry.
Is Dongyue Group Efficiently Re-investing Its Profits?
Despite having a normal three-year median payout ratio of 29% (or a retention ratio of 71% over the past three years, Dongyue Group has seen very little growth in earnings as we saw above. Therefore, there might be some other reasons to explain the lack in that respect. For example, the business could be in decline.
Moreover, Dongyue Group has been paying dividends for at least ten years or more suggesting that management must have perceived that the shareholders prefer dividends over earnings growth. Our latest analyst data shows that the future payout ratio of the company is expected to rise to 45% over the next three years. Consequently, the higher expected payout ratio explains the decline in the company's expected ROE (to 18%) over the same period.
Conclusion
On the whole, we do feel that Dongyue Group has some positive attributes. However, given the high ROE and high profit retention, we would expect the company to be delivering strong earnings growth, but that isn't the case here. This suggests that there might be some external threat to the business, that's hampering its growth. With that said, on studying the latest analyst forecasts, we found that while the company has seen growth in its past earnings, analysts expect its future earnings to shrink. To know more about the company's future earnings growth forecasts take a look at this free report on analyst forecasts for the company to find out more.
Have feedback on this article? Concerned about the content? Get in touch with us directly. Alternatively, email editorial-team (at) simplywallst.com.
This article by Simply Wall St is general in nature. We provide commentary based on historical data and analyst forecasts only using an unbiased methodology and our articles are not intended to be financial advice. It does not constitute a recommendation to buy or sell any stock, and does not take account of your objectives, or your financial situation. We aim to bring you long-term focused analysis driven by fundamental data. Note that our analysis may not factor in the latest price-sensitive company announcements or qualitative material. Simply Wall St has no position in any stocks mentioned.
在看到东岳集团(HKG:189)最近的表现后,很难感到兴奋,其股价在过去三个月里下跌了19%。但如果你密切关注,你可能会发现,该公司的关键财务指标看起来相当不错,这可能意味着,鉴于市场通常会奖励更具弹性的长期基本面因素,该股可能会在长期内上涨。具体地说,我们决定在本文中研究东岳集团的净资产收益率。
股本回报率或净资产收益率是股东要考虑的一个重要因素,因为它告诉他们他们的资本再投资的效率。换句话说,它揭示了该公司成功地将股东投资转化为利润。
查看我们对东岳集团的最新分析
净资产收益率是如何计算的?
股本回报率可使用以下公式计算:
股本回报率=(持续经营的)净利润?股东权益
因此,根据上述公式,东岳集团的净资产收益率为:
23%=39亿元×170亿元(以截至2022年6月的12个月为基础)。
“回报”指的是企业在过去一年中获得的收入。另一种说法是,该公司每持有价值1港元的股票,就能赚取0.23港元的利润。
为什么净资产收益率对收益增长很重要?
我们已经证实,净资产收益率是一家公司未来收益的有效盈利指标。我们现在需要评估公司将多少利润再投资或“保留”用于未来的增长,这就让我们对公司的增长潜力有了一个了解。假设其他条件相同,与没有相同特征的公司相比,拥有更高股本回报率和更高利润保留率的公司通常会有更高的增长率。
东岳集团盈利增长与净资产收益率23%的并列比较
首先,我们承认东岳集团拥有显著较高的净资产收益率。其次,与业内报告的13%的平均净资产收益率相比,我们也注意到了这一点。然而,出于某种原因,东岳集团微不足道的五年平均净利润增长3.8%并没有反映出较高的回报率。这很有趣,因为高回报应该意味着该公司有能力实现高增长,但由于某种原因,它一直未能做到这一点。当一家公司将很大一部分收益作为股息支付,或者面临竞争压力时,这种情况很可能会发生。
接下来,对比行业净收入增长,我们发现东岳集团的报告增长低于同期行业18%的增长,这是我们不愿意看到的。
联交所:189过去盈利增长2022年9月21日盈利增长是股票估值的一个重要因素。投资者下一步需要确定的是,预期的收益增长是否已经计入了股价。这有助于他们确定这只股票是为光明还是黯淡的未来做准备。衡量预期收益增长的一个很好的指标是市盈率,它根据一只股票的盈利前景决定市场愿意为其支付的价格。因此,你可能想看看东岳集团相对于其行业是高市盈率还是低市盈率。
东岳集团是否有效地对其利润进行了再投资?
尽管东岳集团正常的三年中值派息率为29%(或过去三年的留存率为71%),但如上所述,东岳集团的收益增长很小。因此,可能还有其他一些原因来解释这方面的缺乏。例如,这项业务可能正在衰落。
此外,东岳集团至少在十年或更长时间内一直在分红,这表明管理层肯定已经意识到,股东更喜欢分红,而不是盈利增长。我们最新的分析师数据显示,该公司未来三年的派息率预计将升至45%。因此,较高的预期派息率解释了公司同期预期净资产收益率(ROE)下降(至18%)的原因。
结论
总体而言,我们确实觉得东岳集团有一些积极的属性。然而,考虑到高净资产收益率和高利润保留率,我们预计该公司将实现强劲的收益增长,但这里的情况并非如此。这表明,该业务可能面临一些外部威胁,这正在阻碍其增长。话虽如此,在研究最新的分析师预测时,我们发现,尽管该公司过去的收益有所增长,但分析师预计其未来收益将缩水。要了解更多有关该公司未来收益增长预测的信息,请查看以下内容免费报告分析师对该公司的预测,以了解更多信息。
对这篇文章有什么反馈吗?担心内容吗? 保持联系直接与我们联系。或者,也可以给编辑组发电子邮件,地址是implywallst.com。
本文由Simply Wall St.撰写,具有概括性。我们仅使用不偏不倚的方法提供基于历史数据和分析师预测的评论,我们的文章并不打算作为财务建议。它不构成买卖任何股票的建议,也没有考虑你的目标或你的财务状况。我们的目标是为您带来由基本面数据驱动的长期重点分析。请注意,我们的分析可能不会将最新的对价格敏感的公司公告或定性材料考虑在内。Simply Wall St.对上述任何一只股票都没有持仓。
moomoo是Moomoo Technologies Inc.公司提供的金融信息和交易应用程序。
在美国,moomoo上的投资产品和服务由Moomoo Financial Inc.提供,一家受美国证券交易委员会(SEC)监管的持牌主体。 Moomoo Financial Inc.是金融业监管局(FINRA)和证券投资者保护公司(SIPC)的成员。
在新加坡,moomoo上的投资产品和服务是通过Moomoo Financial Singapore Pte. Ltd.提供,该公司受新加坡金融管理局(MAS)监管(牌照号码︰CMS101000) ,持有资本市场服务牌照 (CMS) ,持有财务顾问豁免(Exempt Financial Adviser)资质。本内容未经新加坡金融管理局的审查。
在澳大利亚,moomoo上的金融产品和服务是通过Futu Securities (Australia) Ltd提供,该公司是受澳大利亚证券和投资委员会(ASIC)监管的澳大利亚金融服务许可机构(AFSL No. 224663)。请阅读并理解我们的《金融服务指南》、《条款与条件》、《隐私政策》和其他披露文件,这些文件可在我们的网站 https://www.moomoo.com/au中获取。
在加拿大,通过moomoo应用提供的仅限订单执行的券商服务由Moomoo Financial Canada Inc.提供,并受加拿大投资监管机构(CIRO)监管。
在马来西亚,moomoo上的投资产品和服务是通过Moomoo Securities Malaysia Sdn. Bhd. 提供,该公司受马来西亚证券监督委员会(SC)监管(牌照号码︰eCMSL/A0397/2024) ,持有资本市场服务牌照 (CMSL) 。本内容未经马来西亚证券监督委员会的审查。
Moomoo Technologies Inc., Moomoo Financial Inc., Moomoo Financial Singapore Pte. Ltd., Futu Securities (Australia) Ltd, Moomoo Financial Canada Inc.,和Moomoo Securities Malaysia Sdn. Bhd.是关联公司。
风险及免责提示
moomoo是Moomoo Technologies Inc.公司提供的金融信息和交易应用程序。
在美国,moomoo上的投资产品和服务由Moomoo Financial Inc.提供,一家受美国证券交易委员会(SEC)监管的持牌主体。 Moomoo Financial Inc.是金融业监管局(FINRA)和证券投资者保护公司(SIPC)的成员。
在新加坡,moomoo上的投资产品和服务是通过Moomoo Financial Singapore Pte. Ltd.提供,该公司受新加坡金融管理局(MAS)监管(牌照号码︰CMS101000) ,持有资本市场服务牌照 (CMS) ,持有财务顾问豁免(Exempt Financial Adviser)资质。本内容未经新加坡金融管理局的审查。
在澳大利亚,moomoo上的金融产品和服务是通过Futu Securities (Australia) Ltd提供,该公司是受澳大利亚证券和投资委员会(ASIC)监管的澳大利亚金融服务许可机构(AFSL No. 224663)。请阅读并理解我们的《金融服务指南》、《条款与条件》、《隐私政策》和其他披露文件,这些文件可在我们的网站 https://www.moomoo.com/au中获取。
在加拿大,通过moomoo应用提供的仅限订单执行的券商服务由Moomoo Financial Canada Inc.提供,并受加拿大投资监管机构(CIRO)监管。
在马来西亚,moomoo上的投资产品和服务是通过Moomoo Securities Malaysia Sdn. Bhd. 提供,该公司受马来西亚证券监督委员会(SC)监管(牌照号码︰eCMSL/A0397/2024) ,持有资本市场服务牌照 (CMSL) 。本内容未经马来西亚证券监督委员会的审查。
Moomoo Technologies Inc., Moomoo Financial Inc., Moomoo Financial Singapore Pte. Ltd., Futu Securities (Australia) Ltd, Moomoo Financial Canada Inc.,和Moomoo Securities Malaysia Sdn. Bhd.是关联公司。
- 分享到weixin
- 分享到qq
- 分享到facebook
- 分享到twitter
- 分享到微博
- 粘贴板
使用浏览器的分享功能,分享给你的好友吧