
-
市场
-
产品
-
资讯
-
Moo社区
-
课堂
-
查看更多
-
功能介绍
-
费用费用透明,无最低余额限制
投资选择、功能介绍、费用相关信息由Moomoo Financial Inc.提供
- English
- 中文繁體
- 中文简体
- 深色
- 浅色
The Three-year Earnings Decline Is Not Helping Shenzhen Hepalink Pharmaceutical Group's (SZSE:002399 Share Price, as Stock Falls Another 3.1% in Past Week
The Three-year Earnings Decline Is Not Helping Shenzhen Hepalink Pharmaceutical Group's (SZSE:002399 Share Price, as Stock Falls Another 3.1% in Past Week
As an investor its worth striving to ensure your overall portfolio beats the market average. But its virtually certain that sometimes you will buy stocks that fall short of the market average returns. Unfortunately, that's been the case for longer term Shenzhen Hepalink Pharmaceutical Group Co., Ltd. (SZSE:002399) shareholders, since the share price is down 25% in the last three years, falling well short of the market return of around 25%. Shareholders have had an even rougher run lately, with the share price down 14% in the last 90 days. This could be related to the recent financial results - you can catch up on the most recent data by reading our company report.
If the past week is anything to go by, investor sentiment for Shenzhen Hepalink Pharmaceutical Group isn't positive, so let's see if there's a mismatch between fundamentals and the share price.
Check out our latest analysis for Shenzhen Hepalink Pharmaceutical Group
While markets are a powerful pricing mechanism, share prices reflect investor sentiment, not just underlying business performance. One imperfect but simple way to consider how the market perception of a company has shifted is to compare the change in the earnings per share (EPS) with the share price movement.
Shenzhen Hepalink Pharmaceutical Group saw its EPS decline at a compound rate of 27% per year, over the last three years. In comparison the 9% compound annual share price decline isn't as bad as the EPS drop-off. So, despite the prior disappointment, shareholders must have some confidence the situation will improve, longer term. This positive sentiment is also reflected in the generous P/E ratio of 55.00.
You can see below how EPS has changed over time (discover the exact values by clicking on the image).
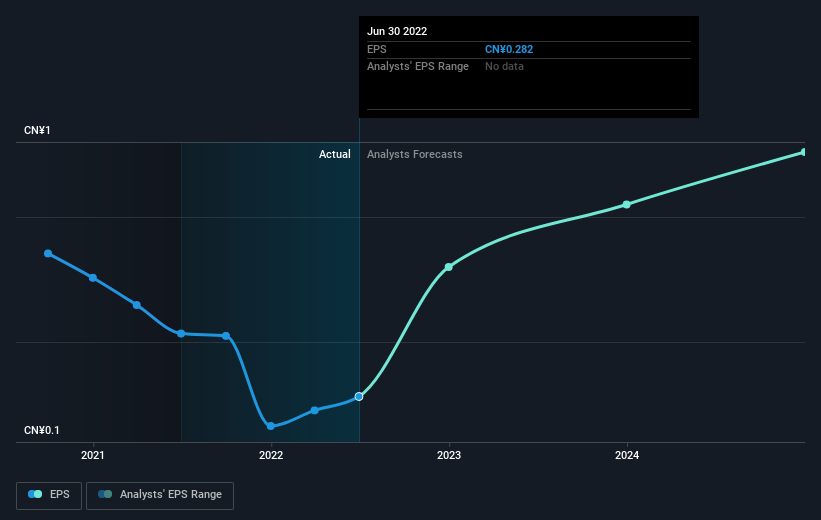 SZSE:002399 Earnings Per Share Growth September 16th 2022
This free interactive report on Shenzhen Hepalink Pharmaceutical Group's earnings, revenue and cash flow is a great place to start, if you want to investigate the stock further.
A Different Perspective
Shenzhen Hepalink Pharmaceutical Group shareholders may not have made money over the last year, but their total loss of 2.7% ( including dividends) isn't as bad as the market loss of around 2.7%. The one-year return is also not as bad as the 7% per annum loss investors have suffered over the last three years. It could well be that the business has begun to stabilize, though the recent returns are hardly impressive. While it is well worth considering the different impacts that market conditions can have on the share price, there are other factors that are even more important. For instance, we've identified 2 warning signs for Shenzhen Hepalink Pharmaceutical Group that you should be aware of.
For those who like to find winning investments this free list of growing companies with recent insider purchasing, could be just the ticket.
Please note, the market returns quoted in this article reflect the market weighted average returns of stocks that currently trade on CN exchanges.
Have feedback on this article? Concerned about the content? Get in touch with us directly. Alternatively, email editorial-team (at) simplywallst.com.
This article by Simply Wall St is general in nature. We provide commentary based on historical data and analyst forecasts only using an unbiased methodology and our articles are not intended to be financial advice. It does not constitute a recommendation to buy or sell any stock, and does not take account of your objectives, or your financial situation. We aim to bring you long-term focused analysis driven by fundamental data. Note that our analysis may not factor in the latest price-sensitive company announcements or qualitative material. Simply Wall St has no position in any stocks mentioned.
作为一名投资者,努力确保你的整体投资组合超过市场平均水平是值得的。但几乎可以肯定的是,有时你会买入低于市场平均回报率的股票。不幸的是,从长远来看,情况就是这样深圳市海普力克药业集团有限公司。(SZSE:002399)股东,因为过去三年股价下跌了25%,远远低于约25%的市场回报率。股东们最近的表现更加艰难,股价在过去90天里下跌了14%。这可能与最近的财务业绩有关-您可以通过阅读我们的公司报告来了解最新的数据。
如果以过去一周为标准,投资者对深圳海普林药业集团的情绪并不乐观,所以让我们来看看基本面和股价之间是否存在错配。
查看我们对深圳海普林药业集团的最新分析
虽然市场是一种强大的定价机制,但股价反映的是投资者情绪,而不仅仅是潜在的企业表现。一种不完美但简单的方法来考虑市场对一家公司的看法是如何改变的,那就是将每股收益(EPS)的变化与股价走势进行比较。
在过去的三年里,深圳海普林药业集团的每股收益以每年27%的复合速度下降。相比之下,9%的复合年度股价跌幅没有每股收益下跌那么严重。因此,尽管之前令人失望,但从长远来看,股东们必须对情况会有所改善有一定的信心。这种积极情绪也反映在55.00的慷慨市盈率上。
您可以在下面看到EPS是如何随着时间的推移而变化的(通过单击图像来了解确切的值)。
深交所:2022年9月16日每股收益增长002399这免费如果你想进一步调查该股,关于深圳海普林药业集团收益、收入和现金流的互动报告是一个很好的起点。
不同的视角
深圳海普瑞药业集团的股东过去一年可能没有赚到钱,但他们2.7%的总亏损(包括股息)没有市场亏损2.7%左右那么糟糕。一年的回报率也没有过去三年投资者遭受的7%的年损失那么糟糕。这很可能是因为业务已经开始企稳,尽管最近的回报并不令人印象深刻。虽然值得考虑市场状况对股价可能产生的不同影响,但还有其他更重要的因素。例如,我们已经确定深圳海普林药业集团的2个警示标志这一点你应该知道。
对于那些想要找到赢得投资这免费最近有内幕收购的不断增长的公司名单可能就是合适的选择。
请注意,本文引用的市场回报反映了目前在CN交易所交易的股票的市场加权平均回报。
对这篇文章有什么反馈吗?担心内容吗? 保持联系直接与我们联系。或者,也可以给编辑组发电子邮件,地址是implywallst.com。
本文由Simply Wall St.撰写,具有概括性。我们仅使用不偏不倚的方法提供基于历史数据和分析师预测的评论,我们的文章并不打算作为财务建议。它不构成买卖任何股票的建议,也没有考虑你的目标或你的财务状况。我们的目标是为您带来由基本面数据驱动的长期重点分析。请注意,我们的分析可能不会将最新的对价格敏感的公司公告或定性材料考虑在内。Simply Wall St.对上述任何一只股票都没有持仓。
moomoo是Moomoo Technologies Inc.公司提供的金融信息和交易应用程序。
在美国,moomoo上的投资产品和服务由Moomoo Financial Inc.提供,一家受美国证券交易委员会(SEC)监管的持牌主体。 Moomoo Financial Inc.是金融业监管局(FINRA)和证券投资者保护公司(SIPC)的成员。
在新加坡,moomoo上的投资产品和服务是通过Moomoo Financial Singapore Pte. Ltd.提供,该公司受新加坡金融管理局(MAS)监管(牌照号码︰CMS101000) ,持有资本市场服务牌照 (CMS) ,持有财务顾问豁免(Exempt Financial Adviser)资质。本内容未经新加坡金融管理局的审查。
在澳大利亚,moomoo上的金融产品和服务是通过Futu Securities (Australia) Ltd提供,该公司是受澳大利亚证券和投资委员会(ASIC)监管的澳大利亚金融服务许可机构(AFSL No. 224663)。请阅读并理解我们的《金融服务指南》、《条款与条件》、《隐私政策》和其他披露文件,这些文件可在我们的网站 https://www.moomoo.com/au中获取。
在加拿大,通过moomoo应用提供的仅限订单执行的券商服务由Moomoo Financial Canada Inc.提供,并受加拿大投资监管机构(CIRO)监管。
在马来西亚,moomoo上的投资产品和服务是通过Moomoo Securities Malaysia Sdn. Bhd. 提供,该公司受马来西亚证券监督委员会(SC)监管(牌照号码︰eCMSL/A0397/2024) ,持有资本市场服务牌照 (CMSL) 。本内容未经马来西亚证券监督委员会的审查。
Moomoo Technologies Inc., Moomoo Financial Inc., Moomoo Financial Singapore Pte. Ltd., Futu Securities (Australia) Ltd, Moomoo Financial Canada Inc.,和Moomoo Securities Malaysia Sdn. Bhd.是关联公司。
风险及免责提示
moomoo是Moomoo Technologies Inc.公司提供的金融信息和交易应用程序。
在美国,moomoo上的投资产品和服务由Moomoo Financial Inc.提供,一家受美国证券交易委员会(SEC)监管的持牌主体。 Moomoo Financial Inc.是金融业监管局(FINRA)和证券投资者保护公司(SIPC)的成员。
在新加坡,moomoo上的投资产品和服务是通过Moomoo Financial Singapore Pte. Ltd.提供,该公司受新加坡金融管理局(MAS)监管(牌照号码︰CMS101000) ,持有资本市场服务牌照 (CMS) ,持有财务顾问豁免(Exempt Financial Adviser)资质。本内容未经新加坡金融管理局的审查。
在澳大利亚,moomoo上的金融产品和服务是通过Futu Securities (Australia) Ltd提供,该公司是受澳大利亚证券和投资委员会(ASIC)监管的澳大利亚金融服务许可机构(AFSL No. 224663)。请阅读并理解我们的《金融服务指南》、《条款与条件》、《隐私政策》和其他披露文件,这些文件可在我们的网站 https://www.moomoo.com/au中获取。
在加拿大,通过moomoo应用提供的仅限订单执行的券商服务由Moomoo Financial Canada Inc.提供,并受加拿大投资监管机构(CIRO)监管。
在马来西亚,moomoo上的投资产品和服务是通过Moomoo Securities Malaysia Sdn. Bhd. 提供,该公司受马来西亚证券监督委员会(SC)监管(牌照号码︰eCMSL/A0397/2024) ,持有资本市场服务牌照 (CMSL) 。本内容未经马来西亚证券监督委员会的审查。
Moomoo Technologies Inc., Moomoo Financial Inc., Moomoo Financial Singapore Pte. Ltd., Futu Securities (Australia) Ltd, Moomoo Financial Canada Inc.,和Moomoo Securities Malaysia Sdn. Bhd.是关联公司。
- 分享到weixin
- 分享到qq
- 分享到facebook
- 分享到twitter
- 分享到微博
- 粘贴板
使用浏览器的分享功能,分享给你的好友吧