
-
市场
-
产品
-
资讯
-
Moo社区
-
课堂
-
查看更多
-
功能介绍
-
费用费用透明,无最低余额限制
投资选择、功能介绍、费用相关信息由Moomoo Financial Inc.提供
- English
- 中文繁體
- 中文简体
- 深色
- 浅色
UniFirst's (NYSE:UNF) 5.0% CAGR Outpaced the Company's Earnings Growth Over the Same Five-year Period
UniFirst's (NYSE:UNF) 5.0% CAGR Outpaced the Company's Earnings Growth Over the Same Five-year Period
If you buy and hold a stock for many years, you'd hope to be making a profit. Better yet, you'd like to see the share price move up more than the market average. But UniFirst Corporation (NYSE:UNF) has fallen short of that second goal, with a share price rise of 25% over five years, which is below the market return. The last year has been disappointing, with the stock price down 19% in that time.
After a strong gain in the past week, it's worth seeing if longer term returns have been driven by improving fundamentals.
Check out our latest analysis for UniFirst
While the efficient markets hypothesis continues to be taught by some, it has been proven that markets are over-reactive dynamic systems, and investors are not always rational. One way to examine how market sentiment has changed over time is to look at the interaction between a company's share price and its earnings per share (EPS).
Over half a decade, UniFirst managed to grow its earnings per share at 1.8% a year. This EPS growth is lower than the 5% average annual increase in the share price. This suggests that market participants hold the company in higher regard, these days. That's not necessarily surprising considering the five-year track record of earnings growth.
You can see how EPS has changed over time in the image below (click on the chart to see the exact values).
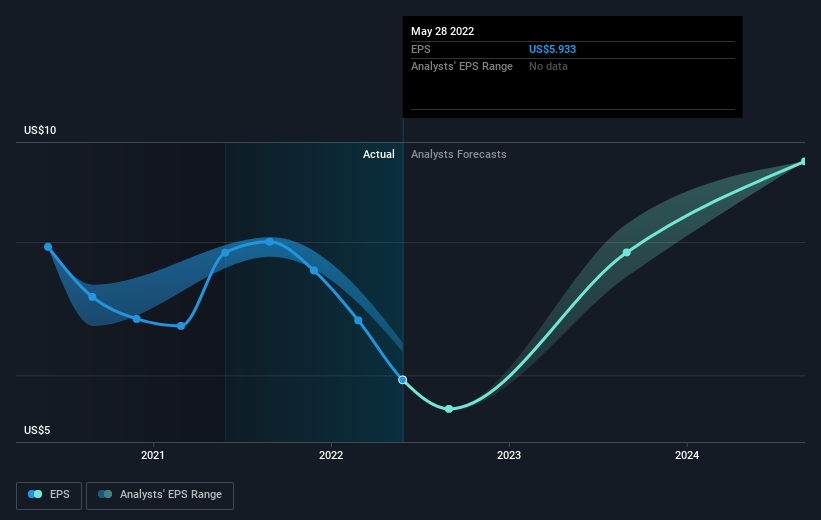 NYSE:UNF Earnings Per Share Growth September 13th 2022
It's probably worth noting that the CEO is paid less than the median at similar sized companies. It's always worth keeping an eye on CEO pay, but a more important question is whether the company will grow earnings throughout the years. It might be well worthwhile taking a look at our free report on UniFirst's earnings, revenue and cash flow.
What About Dividends?
As well as measuring the share price return, investors should also consider the total shareholder return (TSR). The TSR is a return calculation that accounts for the value of cash dividends (assuming that any dividend received was reinvested) and the calculated value of any discounted capital raisings and spin-offs. So for companies that pay a generous dividend, the TSR is often a lot higher than the share price return. We note that for UniFirst the TSR over the last 5 years was 28%, which is better than the share price return mentioned above. The dividends paid by the company have thusly boosted the total shareholder return.
A Different Perspective
While the broader market lost about 13% in the twelve months, UniFirst shareholders did even worse, losing 18% (even including dividends). However, it could simply be that the share price has been impacted by broader market jitters. It might be worth keeping an eye on the fundamentals, in case there's a good opportunity. On the bright side, long term shareholders have made money, with a gain of 5% per year over half a decade. It could be that the recent sell-off is an opportunity, so it may be worth checking the fundamental data for signs of a long term growth trend. I find it very interesting to look at share price over the long term as a proxy for business performance. But to truly gain insight, we need to consider other information, too. To that end, you should be aware of the 1 warning sign we've spotted with UniFirst .
But note: UniFirst may not be the best stock to buy. So take a peek at this free list of interesting companies with past earnings growth (and further growth forecast).
Please note, the market returns quoted in this article reflect the market weighted average returns of stocks that currently trade on US exchanges.
Have feedback on this article? Concerned about the content? Get in touch with us directly. Alternatively, email editorial-team (at) simplywallst.com.
This article by Simply Wall St is general in nature. We provide commentary based on historical data and analyst forecasts only using an unbiased methodology and our articles are not intended to be financial advice. It does not constitute a recommendation to buy or sell any stock, and does not take account of your objectives, or your financial situation. We aim to bring you long-term focused analysis driven by fundamental data. Note that our analysis may not factor in the latest price-sensitive company announcements or qualitative material. Simply Wall St has no position in any stocks mentioned.
如果你购买并持有一只股票多年,你就有希望盈利。更好的是,你希望看到股价的涨幅超过市场平均水平。但UniFirst公司(纽约证券交易所股票代码:UNF)没有达到第二个目标,股价在五年内上涨了25%,低于市场回报率。过去的一年令人失望,股价在此期间下跌了19%。
在过去一周的强劲上涨之后,长期回报是否受到基本面改善的推动值得关注。
查看我们对UniFirst的最新分析
虽然有效市场假说继续被一些人传授,但事实证明,市场是过度反应的动态系统,投资者并不总是理性的。考察市场情绪如何随时间变化的一种方法是观察一家公司的股价和每股收益(EPS)之间的相互作用。
在过去的五年里,UniFirst设法以每年1.8%的速度增长每股收益。这一每股收益增幅低于股价年均5%的增幅。这表明,这些天来,市场参与者对该公司的评价更高。考虑到五年来盈利增长的记录,这并不一定令人惊讶。
您可以在下图中看到EPS是如何随着时间的推移而变化的(单击图表可查看精确值)。
纽约证券交易所:UNF每股收益增长2022年9月13日可能值得注意的是,首席执行官的薪酬低于类似规模公司的中位数。关注首席执行官的薪酬总是值得的,但更重要的问题是,该公司是否会在未来几年实现盈利增长。也许很值得一看我们的免费报告UniFirst的收益、收入和现金流。
那股息呢?
除了衡量股价回报外,投资者还应考虑总股东回报(TSR)。TSR是一种回报计算,计入了现金股息的价值(假设收到的任何股息都进行了再投资),以及任何贴现融资和剥离的计算价值。因此,对于支付丰厚股息的公司来说,TSR往往比股价回报高得多。我们注意到UniFirst在过去5年的TSR为28%,这比上面提到的股价回报要好。该公司支付的股息因此提振了总计股东回报。
不同的视角
虽然大盘在过去12个月里下跌了约13%,但UniFirst的股东表现更差,跌幅为18%(甚至包括股息)。然而,这可能只是因为股价受到了更广泛的市场紧张情绪的影响。也许有必要关注基本面,以防出现良机。好的一面是,长期股东已经赚到了钱,过去五年的年回报率为5%。最近的抛售可能是一个机会,因此可能值得查看基本面数据,以寻找长期增长趋势的迹象。我发现,把股价作为衡量企业业绩的长期指标是非常有趣的。但为了真正获得洞察力,我们还需要考虑其他信息。为此,您应该意识到1个警告标志我们发现了UniFirst。
但请注意:UniFirst可能不是最值得买入的股票。所以让我们来看看这个免费过去有盈利增长(以及进一步增长预测)的有趣公司名单。
请注意,本文引用的市场回报反映了目前在美国交易所交易的股票的市场加权平均回报。
对这篇文章有什么反馈吗?担心内容吗? 保持联系直接与我们联系。或者,也可以给编辑组发电子邮件,地址是implywallst.com。
本文由Simply Wall St.撰写,具有概括性。我们仅使用不偏不倚的方法提供基于历史数据和分析师预测的评论,我们的文章并不打算作为财务建议。它不构成买卖任何股票的建议,也没有考虑你的目标或你的财务状况。我们的目标是为您带来由基本面数据驱动的长期重点分析。请注意,我们的分析可能不会将最新的对价格敏感的公司公告或定性材料考虑在内。Simply Wall St.对上述任何一只股票都没有持仓。
moomoo是Moomoo Technologies Inc.公司提供的金融信息和交易应用程序。
在美国,moomoo上的投资产品和服务由Moomoo Financial Inc.提供,一家受美国证券交易委员会(SEC)监管的持牌主体。 Moomoo Financial Inc.是金融业监管局(FINRA)和证券投资者保护公司(SIPC)的成员。
在新加坡,moomoo上的投资产品和服务是通过Moomoo Financial Singapore Pte. Ltd.提供,该公司受新加坡金融管理局(MAS)监管(牌照号码︰CMS101000) ,持有资本市场服务牌照 (CMS) ,持有财务顾问豁免(Exempt Financial Adviser)资质。本内容未经新加坡金融管理局的审查。
在澳大利亚,moomoo上的金融产品和服务是通过Futu Securities (Australia) Ltd提供,该公司是受澳大利亚证券和投资委员会(ASIC)监管的澳大利亚金融服务许可机构(AFSL No. 224663)。请阅读并理解我们的《金融服务指南》、《条款与条件》、《隐私政策》和其他披露文件,这些文件可在我们的网站 https://www.moomoo.com/au中获取。
在加拿大,通过moomoo应用提供的仅限订单执行的券商服务由Moomoo Financial Canada Inc.提供,并受加拿大投资监管机构(CIRO)监管。
在马来西亚,moomoo上的投资产品和服务是通过Moomoo Securities Malaysia Sdn. Bhd. 提供,该公司受马来西亚证券监督委员会(SC)监管(牌照号码︰eCMSL/A0397/2024) ,持有资本市场服务牌照 (CMSL) 。本内容未经马来西亚证券监督委员会的审查。
Moomoo Technologies Inc., Moomoo Financial Inc., Moomoo Financial Singapore Pte. Ltd., Futu Securities (Australia) Ltd, Moomoo Financial Canada Inc.,和Moomoo Securities Malaysia Sdn. Bhd.是关联公司。
风险及免责提示
moomoo是Moomoo Technologies Inc.公司提供的金融信息和交易应用程序。
在美国,moomoo上的投资产品和服务由Moomoo Financial Inc.提供,一家受美国证券交易委员会(SEC)监管的持牌主体。 Moomoo Financial Inc.是金融业监管局(FINRA)和证券投资者保护公司(SIPC)的成员。
在新加坡,moomoo上的投资产品和服务是通过Moomoo Financial Singapore Pte. Ltd.提供,该公司受新加坡金融管理局(MAS)监管(牌照号码︰CMS101000) ,持有资本市场服务牌照 (CMS) ,持有财务顾问豁免(Exempt Financial Adviser)资质。本内容未经新加坡金融管理局的审查。
在澳大利亚,moomoo上的金融产品和服务是通过Futu Securities (Australia) Ltd提供,该公司是受澳大利亚证券和投资委员会(ASIC)监管的澳大利亚金融服务许可机构(AFSL No. 224663)。请阅读并理解我们的《金融服务指南》、《条款与条件》、《隐私政策》和其他披露文件,这些文件可在我们的网站 https://www.moomoo.com/au中获取。
在加拿大,通过moomoo应用提供的仅限订单执行的券商服务由Moomoo Financial Canada Inc.提供,并受加拿大投资监管机构(CIRO)监管。
在马来西亚,moomoo上的投资产品和服务是通过Moomoo Securities Malaysia Sdn. Bhd. 提供,该公司受马来西亚证券监督委员会(SC)监管(牌照号码︰eCMSL/A0397/2024) ,持有资本市场服务牌照 (CMSL) 。本内容未经马来西亚证券监督委员会的审查。
Moomoo Technologies Inc., Moomoo Financial Inc., Moomoo Financial Singapore Pte. Ltd., Futu Securities (Australia) Ltd, Moomoo Financial Canada Inc.,和Moomoo Securities Malaysia Sdn. Bhd.是关联公司。
- 分享到weixin
- 分享到qq
- 分享到facebook
- 分享到twitter
- 分享到微博
- 粘贴板
使用浏览器的分享功能,分享给你的好友吧