
-
市场
-
产品
-
资讯
-
Moo社区
-
课堂
-
查看更多
-
功能介绍
-
费用费用透明,无最低余额限制
投资选择、功能介绍、费用相关信息由Moomoo Financial Inc.提供
- English
- 中文繁體
- 中文简体
- 深色
- 浅色
Investors in China Resources Medical Holdings (HKG:1515) From Five Years Ago Are Still Down 49%, Even After 8.4% Gain This Past Week
Investors in China Resources Medical Holdings (HKG:1515) From Five Years Ago Are Still Down 49%, Even After 8.4% Gain This Past Week
For many, the main point of investing is to generate higher returns than the overall market. But even the best stock picker will only win with some selections. So we wouldn't blame long term China Resources Medical Holdings Company Limited (HKG:1515) shareholders for doubting their decision to hold, with the stock down 54% over a half decade. We also note that the stock has performed poorly over the last year, with the share price down 32%. On the other hand the share price has bounced 8.4% over the last week.
The recent uptick of 8.4% could be a positive sign of things to come, so let's take a lot at historical fundamentals.
View our latest analysis for China Resources Medical Holdings
In his essay The Superinvestors of Graham-and-Doddsville Warren Buffett described how share prices do not always rationally reflect the value of a business. One flawed but reasonable way to assess how sentiment around a company has changed is to compare the earnings per share (EPS) with the share price.
During five years of share price growth, China Resources Medical Holdings moved from a loss to profitability. Most would consider that to be a good thing, so it's counter-intuitive to see the share price declining. Other metrics might give us a better handle on how its value is changing over time.
In contrast to the share price, revenue has actually increased by 23% a year in the five year period. A more detailed examination of the revenue and earnings may or may not explain why the share price languishes; there could be an opportunity.
You can see how earnings and revenue have changed over time in the image below (click on the chart to see the exact values).
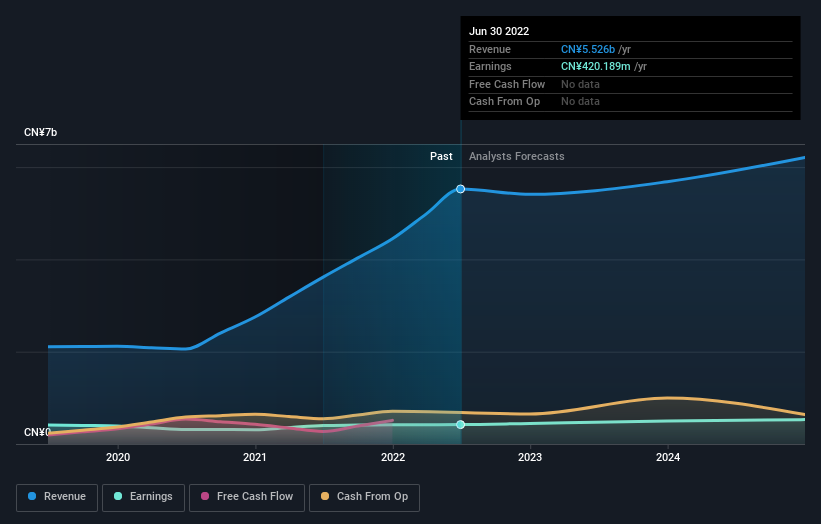 SEHK:1515 Earnings and Revenue Growth August 30th 2022
Balance sheet strength is crucial. It might be well worthwhile taking a look at our free report on how its financial position has changed over time.
What About Dividends?
As well as measuring the share price return, investors should also consider the total shareholder return (TSR). The TSR is a return calculation that accounts for the value of cash dividends (assuming that any dividend received was reinvested) and the calculated value of any discounted capital raisings and spin-offs. It's fair to say that the TSR gives a more complete picture for stocks that pay a dividend. In the case of China Resources Medical Holdings, it has a TSR of -49% for the last 5 years. That exceeds its share price return that we previously mentioned. This is largely a result of its dividend payments!
A Different Perspective
We regret to report that China Resources Medical Holdings shareholders are down 30% for the year (even including dividends). Unfortunately, that's worse than the broader market decline of 19%. However, it could simply be that the share price has been impacted by broader market jitters. It might be worth keeping an eye on the fundamentals, in case there's a good opportunity. Unfortunately, last year's performance may indicate unresolved challenges, given that it was worse than the annualised loss of 8% over the last half decade. Generally speaking long term share price weakness can be a bad sign, though contrarian investors might want to research the stock in hope of a turnaround. While it is well worth considering the different impacts that market conditions can have on the share price, there are other factors that are even more important. Even so, be aware that China Resources Medical Holdings is showing 2 warning signs in our investment analysis , you should know about...
We will like China Resources Medical Holdings better if we see some big insider buys. While we wait, check out this free list of growing companies with considerable, recent, insider buying.
Please note, the market returns quoted in this article reflect the market weighted average returns of stocks that currently trade on HK exchanges.
Have feedback on this article? Concerned about the content? Get in touch with us directly. Alternatively, email editorial-team (at) simplywallst.com.
This article by Simply Wall St is general in nature. We provide commentary based on historical data and analyst forecasts only using an unbiased methodology and our articles are not intended to be financial advice. It does not constitute a recommendation to buy or sell any stock, and does not take account of your objectives, or your financial situation. We aim to bring you long-term focused analysis driven by fundamental data. Note that our analysis may not factor in the latest price-sensitive company announcements or qualitative material. Simply Wall St has no position in any stocks mentioned.
对许多人来说,投资的主要目的是创造比整体市场更高的回报。但即使是最好的选股者也只有在一些选择。所以我们不会责怪长期华润医疗控股有限公司(HKG:1515)股东对他们持有股票的决定表示怀疑,该股在五年内下跌了54%。我们还注意到,该股在过去一年表现不佳,股价下跌了32%。另一方面,该公司股价在过去一周里反弹了8.4%。
最近8.4%的涨幅可能是未来事情的积极迹象,所以让我们来看看历史基本面。
查看我们对华润医疗控股的最新分析
在他的文章中格雷厄姆和多德斯维尔的超级投资者沃伦·巴菲特描述了股价并不总是理性地反映一家企业的价值。评估围绕一家公司的情绪变化的一个有缺陷但合理的方法是将每股收益(EPS)与股价进行比较。
在股价增长的五年中,华润医疗控股从亏损转为盈利。大多数人会认为这是一件好事,所以看到股价下跌是有违常理的。其他指标可能会让我们更好地了解其价值是如何随着时间的推移而变化的。
与股价形成对比的是,在这五年期间,营收实际上以每年23%的速度增长。对营收和收益进行更详细的审查,可能会解释股价低迷的原因,也可能解释不了;可能会有机会。
您可以在下图中看到收益和收入随时间的变化(单击图表查看确切的值)。
联交所:2022年8月30日盈利及收入增长1515资产负债表的强健至关重要。也许很值得一看我们的免费报告其财务状况如何随着时间的推移而发生变化。
那股息呢?
除了衡量股价回报外,投资者还应考虑总股东回报(TSR)。TSR是一种回报计算,计入了现金股息的价值(假设收到的任何股息都进行了再投资),以及任何贴现融资和剥离的计算价值。公平地说,TSR为支付股息的股票提供了更完整的图景。以华润医疗控股为例,其最近5年的总资产收益率为-49%。这超过了我们之前提到的它的股价回报。这在很大程度上是其股息支付的结果!
不同的视角
我们遗憾地报告,华润医疗控股的股东今年以来下跌了30%(即使包括股息)。不幸的是,这比大盘19%的跌幅还要糟糕。然而,这可能只是因为股价受到了更广泛的市场紧张情绪的影响。也许有必要关注基本面,以防出现良机。不幸的是,去年的表现可能预示着尚未解决的挑战,因为它比过去五年8%的年化损失更糟糕。一般来说,股价长期疲软可能是一个坏信号,尽管反向投资者可能会希望研究这只股票,希望它能好转。虽然值得考虑市场状况对股价可能产生的不同影响,但还有其他更重要的因素。即便如此,请注意华润医疗控股公司正在展示我们的投资分析中的2个警告信号,你应该知道关于……
如果我们看到一些大的内部收购,我们会更喜欢华润医疗控股。在我们等待的时候,看看这个免费最近有大量内幕收购的成长型公司名单。
请注意,本文引用的市场回报反映了目前在香港交易所交易的股票的市场加权平均回报。
对这篇文章有什么反馈吗?担心内容吗? 保持联系直接与我们联系。或者,也可以给编辑组发电子邮件,地址是implywallst.com。
本文由Simply Wall St.撰写,具有概括性。我们仅使用不偏不倚的方法提供基于历史数据和分析师预测的评论,我们的文章并不打算作为财务建议。它不构成买卖任何股票的建议,也没有考虑你的目标或你的财务状况。我们的目标是为您带来由基本面数据驱动的长期重点分析。请注意,我们的分析可能不会将最新的对价格敏感的公司公告或定性材料考虑在内。Simply Wall St.对上述任何一只股票都没有持仓。
moomoo是Moomoo Technologies Inc.公司提供的金融信息和交易应用程序。
在美国,moomoo上的投资产品和服务由Moomoo Financial Inc.提供,一家受美国证券交易委员会(SEC)监管的持牌主体。 Moomoo Financial Inc.是金融业监管局(FINRA)和证券投资者保护公司(SIPC)的成员。
在新加坡,moomoo上的投资产品和服务是通过Moomoo Financial Singapore Pte. Ltd.提供,该公司受新加坡金融管理局(MAS)监管(牌照号码︰CMS101000) ,持有资本市场服务牌照 (CMS) ,持有财务顾问豁免(Exempt Financial Adviser)资质。本内容未经新加坡金融管理局的审查。
在澳大利亚,moomoo上的金融产品和服务是通过Futu Securities (Australia) Ltd提供,该公司是受澳大利亚证券和投资委员会(ASIC)监管的澳大利亚金融服务许可机构(AFSL No. 224663)。请阅读并理解我们的《金融服务指南》、《条款与条件》、《隐私政策》和其他披露文件,这些文件可在我们的网站 https://www.moomoo.com/au中获取。
在加拿大,通过moomoo应用提供的仅限订单执行的券商服务由Moomoo Financial Canada Inc.提供,并受加拿大投资监管机构(CIRO)监管。
在马来西亚,moomoo上的投资产品和服务是通过Moomoo Securities Malaysia Sdn. Bhd. 提供,该公司受马来西亚证券监督委员会(SC)监管(牌照号码︰eCMSL/A0397/2024) ,持有资本市场服务牌照 (CMSL) 。本内容未经马来西亚证券监督委员会的审查。
Moomoo Technologies Inc., Moomoo Financial Inc., Moomoo Financial Singapore Pte. Ltd., Futu Securities (Australia) Ltd, Moomoo Financial Canada Inc.,和Moomoo Securities Malaysia Sdn. Bhd.是关联公司。
风险及免责提示
moomoo是Moomoo Technologies Inc.公司提供的金融信息和交易应用程序。
在美国,moomoo上的投资产品和服务由Moomoo Financial Inc.提供,一家受美国证券交易委员会(SEC)监管的持牌主体。 Moomoo Financial Inc.是金融业监管局(FINRA)和证券投资者保护公司(SIPC)的成员。
在新加坡,moomoo上的投资产品和服务是通过Moomoo Financial Singapore Pte. Ltd.提供,该公司受新加坡金融管理局(MAS)监管(牌照号码︰CMS101000) ,持有资本市场服务牌照 (CMS) ,持有财务顾问豁免(Exempt Financial Adviser)资质。本内容未经新加坡金融管理局的审查。
在澳大利亚,moomoo上的金融产品和服务是通过Futu Securities (Australia) Ltd提供,该公司是受澳大利亚证券和投资委员会(ASIC)监管的澳大利亚金融服务许可机构(AFSL No. 224663)。请阅读并理解我们的《金融服务指南》、《条款与条件》、《隐私政策》和其他披露文件,这些文件可在我们的网站 https://www.moomoo.com/au中获取。
在加拿大,通过moomoo应用提供的仅限订单执行的券商服务由Moomoo Financial Canada Inc.提供,并受加拿大投资监管机构(CIRO)监管。
在马来西亚,moomoo上的投资产品和服务是通过Moomoo Securities Malaysia Sdn. Bhd. 提供,该公司受马来西亚证券监督委员会(SC)监管(牌照号码︰eCMSL/A0397/2024) ,持有资本市场服务牌照 (CMSL) 。本内容未经马来西亚证券监督委员会的审查。
Moomoo Technologies Inc., Moomoo Financial Inc., Moomoo Financial Singapore Pte. Ltd., Futu Securities (Australia) Ltd, Moomoo Financial Canada Inc.,和Moomoo Securities Malaysia Sdn. Bhd.是关联公司。
- 分享到weixin
- 分享到qq
- 分享到facebook
- 分享到twitter
- 分享到微博
- 粘贴板
使用浏览器的分享功能,分享给你的好友吧