
-
市场
-
产品
-
资讯
-
Moo社区
-
课堂
-
查看更多
-
功能介绍
-
费用费用透明,无最低余额限制
投资选择、功能介绍、费用相关信息由Moomoo Financial Inc.提供
- English
- 中文繁體
- 中文简体
- 深色
- 浅色
The Total Return for Yadea Group Holdings (HKG:1585) Investors Has Risen Faster Than Earnings Growth Over the Last Three Years
The Total Return for Yadea Group Holdings (HKG:1585) Investors Has Risen Faster Than Earnings Growth Over the Last Three Years
We think that it's fair to say that the possibility of finding fantastic multi-year winners is what motivates many investors. But when you hold the right stock for the right time period, the rewards can be truly huge. One bright shining star stock has been Yadea Group Holdings Ltd. (HKG:1585), which is 934% higher than three years ago. On top of that, the share price is up 22% in about a quarter. We love happy stories like this one. The company should be really proud of that performance!
While the stock has fallen 3.5% this week, it's worth focusing on the longer term and seeing if the stocks historical returns have been driven by the underlying fundamentals.
Check out our latest analysis for Yadea Group Holdings
While markets are a powerful pricing mechanism, share prices reflect investor sentiment, not just underlying business performance. One flawed but reasonable way to assess how sentiment around a company has changed is to compare the earnings per share (EPS) with the share price.
Yadea Group Holdings was able to grow its EPS at 48% per year over three years, sending the share price higher. In comparison, the 118% per year gain in the share price outpaces the EPS growth. This indicates that the market is feeling more optimistic on the stock, after the last few years of progress. It's not unusual to see the market 're-rate' a stock, after a few years of growth.
The graphic below depicts how EPS has changed over time (unveil the exact values by clicking on the image).
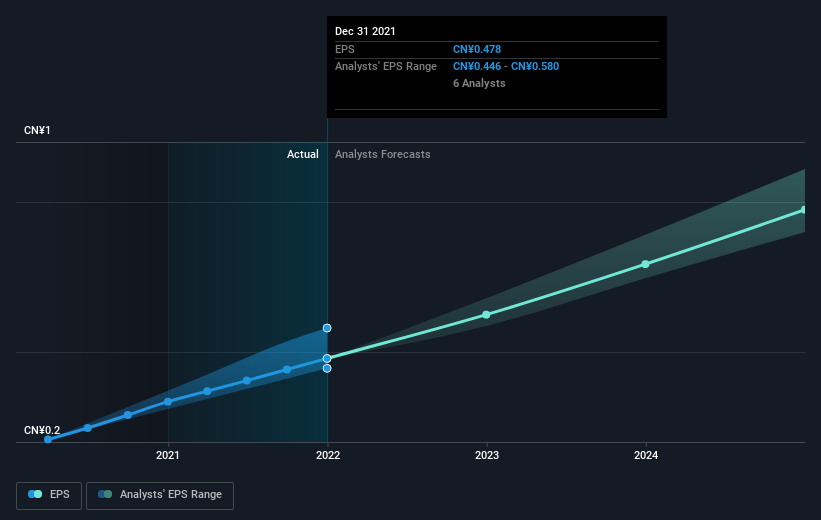 SEHK:1585 Earnings Per Share Growth August 25th 2022
We like that insiders have been buying shares in the last twelve months. Even so, future earnings will be far more important to whether current shareholders make money. This free interactive report on Yadea Group Holdings' earnings, revenue and cash flow is a great place to start, if you want to investigate the stock further.
What About Dividends?
As well as measuring the share price return, investors should also consider the total shareholder return (TSR). Whereas the share price return only reflects the change in the share price, the TSR includes the value of dividends (assuming they were reinvested) and the benefit of any discounted capital raising or spin-off. It's fair to say that the TSR gives a more complete picture for stocks that pay a dividend. We note that for Yadea Group Holdings the TSR over the last 3 years was 975%, which is better than the share price return mentioned above. And there's no prize for guessing that the dividend payments largely explain the divergence!
A Different Perspective
It's nice to see that Yadea Group Holdings shareholders have received a total shareholder return of 9.7% over the last year. Of course, that includes the dividend. However, the TSR over five years, coming in at 53% per year, is even more impressive. The pessimistic view would be that be that the stock has its best days behind it, but on the other hand the price might simply be moderating while the business itself continues to execute. It's always interesting to track share price performance over the longer term. But to understand Yadea Group Holdings better, we need to consider many other factors. Even so, be aware that Yadea Group Holdings is showing 1 warning sign in our investment analysis , you should know about...
If you like to buy stocks alongside management, then you might just love this free list of companies. (Hint: insiders have been buying them).
Please note, the market returns quoted in this article reflect the market weighted average returns of stocks that currently trade on HK exchanges.
Have feedback on this article? Concerned about the content? Get in touch with us directly. Alternatively, email editorial-team (at) simplywallst.com.
This article by Simply Wall St is general in nature. We provide commentary based on historical data and analyst forecasts only using an unbiased methodology and our articles are not intended to be financial advice. It does not constitute a recommendation to buy or sell any stock, and does not take account of your objectives, or your financial situation. We aim to bring you long-term focused analysis driven by fundamental data. Note that our analysis may not factor in the latest price-sensitive company announcements or qualitative material. Simply Wall St has no position in any stocks mentioned.
我们认为,公平地说,找到出色的多年赢家的可能性是激励许多投资者的原因。但当你在正确的时间段持有正确的股票时,回报可能真的是巨大的。一个闪亮的明星股票一直是亚迪亚集团控股有限公司(HKG:1585),比三年前高出934%。最重要的是,该公司股价在大约一个季度内上涨了22%。我们喜欢这样的快乐故事。公司应该为这一表现感到非常自豪!
尽管该股本周下跌了3.5%,但值得关注的是更长期的,看看这些股票的历史回报是否受到了基本面因素的推动。
查看我们对雅迪亚集团控股的最新分析
虽然市场是一种强大的定价机制,但股价反映的是投资者情绪,而不仅仅是潜在的企业表现。评估围绕一家公司的情绪变化的一个有缺陷但合理的方法是将每股收益(EPS)与股价进行比较。
亚迪亚集团控股能够在三年内以每年48%的速度增长每股收益,推动股价走高。相比之下,股价每年118%的涨幅超过了每股收益的增长。这表明,在经历了过去几年的上涨后,市场对该股的看法变得更加乐观。在经历了几年的增长后,市场对一只股票进行重新评级的情况并不少见。
下图描述了EPS是如何随着时间的推移而变化的(通过单击图像来揭示确切的值)。
联交所:2022年8月25日每股盈利增长1585我们喜欢的是,内部人士在过去12个月一直在买入股票。即便如此,未来的收益对现有股东是否赚钱将重要得多。这免费如果你想进一步调查亚迪亚集团的股票,那么关于亚迪亚集团控股的收益、收入和现金流的互动报告是一个很好的起点。
那股息呢?
除了衡量股价回报外,投资者还应考虑总股东回报(TSR)。虽然股价回报只反映股价的变动,但TSR包括股息的价值(假设股息再投资),以及任何折价集资或分拆所带来的利益。公平地说,TSR为支付股息的股票提供了更完整的图景。我们注意到,亚迪亚集团控股过去3年的总回报率为975%,好于上述股价回报率。而且,猜测股息支付在很大程度上解释了这种差异是没有好处的!
不同的视角
很高兴看到亚迪亚集团控股的股东在过去一年中获得了9.7%的总股东回报。当然,这包括股息。然而,五年来的TSR,以每年53%的速度增长,更令人印象深刻。悲观的观点是,该股的最佳时期已经过去,但另一方面,当业务本身继续执行时,价格可能只是在放缓。跟踪股价的长期表现总是很有趣的。但要更好地了解亚迪亚集团控股,我们还需要考虑许多其他因素。即便如此,请注意,雅迪亚集团控股公司正在展示在我们的投资分析中出现1个警告信号,你应该知道关于……
如果你喜欢和管理层一起买股票,那么你可能会喜欢这本书免费公司名单。(提示:内部人士一直在买入这些股票)。
请注意,本文引用的市场回报反映了目前在香港交易所交易的股票的市场加权平均回报。
对这篇文章有什么反馈吗?担心内容吗? 保持联系直接与我们联系。或者,也可以给编辑组发电子邮件,地址是implywallst.com。
本文由Simply Wall St.撰写,具有概括性。我们仅使用不偏不倚的方法提供基于历史数据和分析师预测的评论,我们的文章并不打算作为财务建议。它不构成买卖任何股票的建议,也没有考虑你的目标或你的财务状况。我们的目标是为您带来由基本面数据驱动的长期重点分析。请注意,我们的分析可能不会将最新的对价格敏感的公司公告或定性材料考虑在内。Simply Wall St.对上述任何一只股票都没有持仓。
moomoo是Moomoo Technologies Inc.公司提供的金融信息和交易应用程序。
在美国,moomoo上的投资产品和服务由Moomoo Financial Inc.提供,一家受美国证券交易委员会(SEC)监管的持牌主体。 Moomoo Financial Inc.是金融业监管局(FINRA)和证券投资者保护公司(SIPC)的成员。
在新加坡,moomoo上的投资产品和服务是通过Moomoo Financial Singapore Pte. Ltd.提供,该公司受新加坡金融管理局(MAS)监管(牌照号码︰CMS101000) ,持有资本市场服务牌照 (CMS) ,持有财务顾问豁免(Exempt Financial Adviser)资质。本内容未经新加坡金融管理局的审查。
在澳大利亚,moomoo上的金融产品和服务是通过Futu Securities (Australia) Ltd提供,该公司是受澳大利亚证券和投资委员会(ASIC)监管的澳大利亚金融服务许可机构(AFSL No. 224663)。请阅读并理解我们的《金融服务指南》、《条款与条件》、《隐私政策》和其他披露文件,这些文件可在我们的网站 https://www.moomoo.com/au中获取。
在加拿大,通过moomoo应用提供的仅限订单执行的券商服务由Moomoo Financial Canada Inc.提供,并受加拿大投资监管机构(CIRO)监管。
在马来西亚,moomoo上的投资产品和服务是通过Moomoo Securities Malaysia Sdn. Bhd. 提供,该公司受马来西亚证券监督委员会(SC)监管(牌照号码︰eCMSL/A0397/2024) ,持有资本市场服务牌照 (CMSL) 。本内容未经马来西亚证券监督委员会的审查。
Moomoo Technologies Inc., Moomoo Financial Inc., Moomoo Financial Singapore Pte. Ltd., Futu Securities (Australia) Ltd, Moomoo Financial Canada Inc.,和Moomoo Securities Malaysia Sdn. Bhd.是关联公司。
风险及免责提示
moomoo是Moomoo Technologies Inc.公司提供的金融信息和交易应用程序。
在美国,moomoo上的投资产品和服务由Moomoo Financial Inc.提供,一家受美国证券交易委员会(SEC)监管的持牌主体。 Moomoo Financial Inc.是金融业监管局(FINRA)和证券投资者保护公司(SIPC)的成员。
在新加坡,moomoo上的投资产品和服务是通过Moomoo Financial Singapore Pte. Ltd.提供,该公司受新加坡金融管理局(MAS)监管(牌照号码︰CMS101000) ,持有资本市场服务牌照 (CMS) ,持有财务顾问豁免(Exempt Financial Adviser)资质。本内容未经新加坡金融管理局的审查。
在澳大利亚,moomoo上的金融产品和服务是通过Futu Securities (Australia) Ltd提供,该公司是受澳大利亚证券和投资委员会(ASIC)监管的澳大利亚金融服务许可机构(AFSL No. 224663)。请阅读并理解我们的《金融服务指南》、《条款与条件》、《隐私政策》和其他披露文件,这些文件可在我们的网站 https://www.moomoo.com/au中获取。
在加拿大,通过moomoo应用提供的仅限订单执行的券商服务由Moomoo Financial Canada Inc.提供,并受加拿大投资监管机构(CIRO)监管。
在马来西亚,moomoo上的投资产品和服务是通过Moomoo Securities Malaysia Sdn. Bhd. 提供,该公司受马来西亚证券监督委员会(SC)监管(牌照号码︰eCMSL/A0397/2024) ,持有资本市场服务牌照 (CMSL) 。本内容未经马来西亚证券监督委员会的审查。
Moomoo Technologies Inc., Moomoo Financial Inc., Moomoo Financial Singapore Pte. Ltd., Futu Securities (Australia) Ltd, Moomoo Financial Canada Inc.,和Moomoo Securities Malaysia Sdn. Bhd.是关联公司。
- 分享到weixin
- 分享到qq
- 分享到facebook
- 分享到twitter
- 分享到微博
- 粘贴板
使用浏览器的分享功能,分享给你的好友吧