
-
市场
-
产品
-
资讯
-
Moo社区
-
课堂
-
查看更多
-
功能介绍
-
费用费用透明,无最低余额限制
投资选择、功能介绍、费用相关信息由Moomoo Financial Inc.提供
- English
- 中文繁體
- 中文简体
- 深色
- 浅色
China International Capital (HKG:3908) investors are sitting on a loss of 18% if they invested a year ago
China International Capital (HKG:3908) investors are sitting on a loss of 18% if they invested a year ago
Investors can earn very close to the average market return by buying an index fund. By comparison, an individual stock is unlikely to match market returns - and could well fall short. For example, that's what happened with China International Capital Corporation Limited (HKG:3908) over the last year - it's share price is down 19% versus a market decline of 15%. Longer term investors have fared much better, since the share price is up 2.4% in three years. Even worse, it's down 14% in about a month, which isn't fun at all. However, we note the price may have been impacted by the broader market, which is down 7.6% in the same time period.
Since shareholders are down over the longer term, lets look at the underlying fundamentals over the that time and see if they've been consistent with returns.
View our latest analysis for China International Capital
To quote Buffett, 'Ships will sail around the world but the Flat Earth Society will flourish. There will continue to be wide discrepancies between price and value in the marketplace...' One flawed but reasonable way to assess how sentiment around a company has changed is to compare the earnings per share (EPS) with the share price.
Even though the China International Capital share price is down over the year, its EPS actually improved. Of course, the situation might betray previous over-optimism about growth.
The divergence between the EPS and the share price is quite notable, during the year. So it's easy to justify a look at some other metrics.
China International Capital's revenue is actually up 11% over the last year. Since we can't easily explain the share price movement based on these metrics, it might be worth considering how market sentiment has changed towards the stock.
You can see how earnings and revenue have changed over time in the image below (click on the chart to see the exact values).
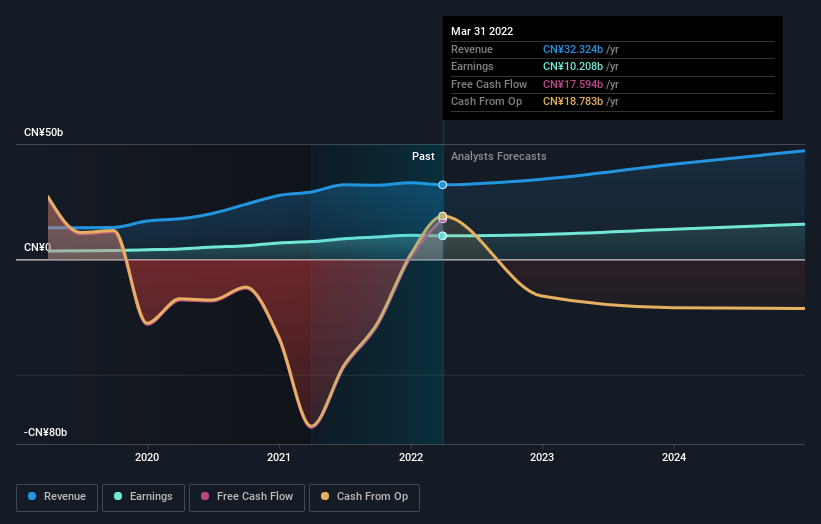 SEHK:3908 Earnings and Revenue Growth July 29th 2022
China International Capital is a well known stock, with plenty of analyst coverage, suggesting some visibility into future growth. Given we have quite a good number of analyst forecasts, it might be well worth checking out this free chart depicting consensus estimates.
A Different Perspective
We regret to report that China International Capital shareholders are down 18% for the year (even including dividends). Unfortunately, that's worse than the broader market decline of 15%. Having said that, it's inevitable that some stocks will be oversold in a falling market. The key is to keep your eyes on the fundamental developments. On the bright side, long term shareholders have made money, with a gain of 3% per year over half a decade. It could be that the recent sell-off is an opportunity, so it may be worth checking the fundamental data for signs of a long term growth trend. Before deciding if you like the current share price, check how China International Capital scores on these 3 valuation metrics.
We will like China International Capital better if we see some big insider buys. While we wait, check out this free list of growing companies with considerable, recent, insider buying.
Please note, the market returns quoted in this article reflect the market weighted average returns of stocks that currently trade on HK exchanges.
Have feedback on this article? Concerned about the content? Get in touch with us directly. Alternatively, email editorial-team (at) simplywallst.com.
This article by Simply Wall St is general in nature. We provide commentary based on historical data and analyst forecasts only using an unbiased methodology and our articles are not intended to be financial advice. It does not constitute a recommendation to buy or sell any stock, and does not take account of your objectives, or your financial situation. We aim to bring you long-term focused analysis driven by fundamental data. Note that our analysis may not factor in the latest price-sensitive company announcements or qualitative material. Simply Wall St has no position in any stocks mentioned.
投资者可以通过购买指数基金来赚取非常接近平均市场回报的收益。相比之下,一只个股不太可能与市场回报相提并论--而且很可能达不到。例如,这就是发生在中金公司有限公司(HKG:3908)在过去的一年里,它的股价下跌了19%,而市场跌幅为15%。长期投资者的表现要好得多,因为该公司股价在三年内上涨了2.4%。更糟糕的是,它在大约一个月内下跌了14%,这一点都不好玩。然而,我们注意到价格可能受到了大盘的影响,同期大盘下跌了7.6%。
由于股东在较长期内下跌,让我们看看这段时间的基本基本面,看看它们是否与回报一致。
查看我们对中国国际金融的最新分析
用巴菲特的话说,“船只将在世界各地航行,但平坦的地球协会将蓬勃发展。市场上的价格和价值之间将继续存在巨大的差异……”评估围绕一家公司的情绪变化的一个有缺陷但合理的方法是将每股收益(EPS)与股价进行比较。
尽管中国国际金融的股价在过去一年里有所下降,但其每股收益实际上有所改善。当然,这种情况可能会暴露出之前对增长的过度乐观。
在这一年中,每股收益和股价之间的背离相当明显。因此,很容易证明看看其他一些指标是合理的。
中金公司的营收实际上比去年增长了11%。由于我们不能轻易地根据这些指标来解释股价走势,或许值得考虑一下市场情绪是如何改变对股票的看法的。
您可以在下图中看到收益和收入随时间的变化(单击图表查看确切的值)。
联交所:3908盈利及收入增长2022年7月29日中国国际金融是一只知名的股票,有大量的分析师报道,这表明它对未来的增长有一定的可见性。鉴于我们有相当多的分析师预测,可能很值得查看以下内容免费描绘共识估计的图表。
不同的视角
我们遗憾地报告,中国国际金融公司的股东今年以来下降了18%(甚至包括股息)。不幸的是,这比大盘15%的跌幅还要糟糕。话虽如此,在下跌的市场中,一些股票不可避免地会被超卖。关键是要密切关注基本面的发展。好的一面是,长期股东已经赚到了钱,过去五年的年回报率为3%。最近的抛售可能是一个机会,因此可能值得查看基本面数据,以寻找长期增长趋势的迹象。在决定你是否喜欢目前的股价之前,先看看中金公司在这三个估值指标上的得分。
如果我们看到一些大的内部收购,我们会更喜欢中金公司。在我们等待的时候,看看这个免费最近有大量内幕收购的成长型公司名单。
请注意,本文引用的市场回报反映了目前在香港交易所交易的股票的市场加权平均回报。
对这篇文章有什么反馈吗?担心内容吗? 保持联系直接与我们联系。或者,也可以给编辑组发电子邮件,地址是implywallst.com。
本文由Simply Wall St.撰写,具有概括性。我们仅使用不偏不倚的方法提供基于历史数据和分析师预测的评论,我们的文章并不打算作为财务建议。它不构成买卖任何股票的建议,也没有考虑你的目标或你的财务状况。我们的目标是为您带来由基本面数据驱动的长期重点分析。请注意,我们的分析可能不会将最新的对价格敏感的公司公告或定性材料考虑在内。Simply Wall St.对上述任何一只股票都没有持仓。
moomoo是Moomoo Technologies Inc.公司提供的金融信息和交易应用程序。
在美国,moomoo上的投资产品和服务由Moomoo Financial Inc.提供,一家受美国证券交易委员会(SEC)监管的持牌主体。 Moomoo Financial Inc.是金融业监管局(FINRA)和证券投资者保护公司(SIPC)的成员。
在新加坡,moomoo上的投资产品和服务是通过Moomoo Financial Singapore Pte. Ltd.提供,该公司受新加坡金融管理局(MAS)监管(牌照号码︰CMS101000) ,持有资本市场服务牌照 (CMS) ,持有财务顾问豁免(Exempt Financial Adviser)资质。本内容未经新加坡金融管理局的审查。
在澳大利亚,moomoo上的金融产品和服务是通过Futu Securities (Australia) Ltd提供,该公司是受澳大利亚证券和投资委员会(ASIC)监管的澳大利亚金融服务许可机构(AFSL No. 224663)。请阅读并理解我们的《金融服务指南》、《条款与条件》、《隐私政策》和其他披露文件,这些文件可在我们的网站 https://www.moomoo.com/au中获取。
在加拿大,通过moomoo应用提供的仅限订单执行的券商服务由Moomoo Financial Canada Inc.提供,并受加拿大投资监管机构(CIRO)监管。
在马来西亚,moomoo上的投资产品和服务是通过Moomoo Securities Malaysia Sdn. Bhd. 提供,该公司受马来西亚证券监督委员会(SC)监管(牌照号码︰eCMSL/A0397/2024) ,持有资本市场服务牌照 (CMSL) 。本内容未经马来西亚证券监督委员会的审查。
Moomoo Technologies Inc., Moomoo Financial Inc., Moomoo Financial Singapore Pte. Ltd., Futu Securities (Australia) Ltd, Moomoo Financial Canada Inc.,和Moomoo Securities Malaysia Sdn. Bhd.是关联公司。
风险及免责提示
moomoo是Moomoo Technologies Inc.公司提供的金融信息和交易应用程序。
在美国,moomoo上的投资产品和服务由Moomoo Financial Inc.提供,一家受美国证券交易委员会(SEC)监管的持牌主体。 Moomoo Financial Inc.是金融业监管局(FINRA)和证券投资者保护公司(SIPC)的成员。
在新加坡,moomoo上的投资产品和服务是通过Moomoo Financial Singapore Pte. Ltd.提供,该公司受新加坡金融管理局(MAS)监管(牌照号码︰CMS101000) ,持有资本市场服务牌照 (CMS) ,持有财务顾问豁免(Exempt Financial Adviser)资质。本内容未经新加坡金融管理局的审查。
在澳大利亚,moomoo上的金融产品和服务是通过Futu Securities (Australia) Ltd提供,该公司是受澳大利亚证券和投资委员会(ASIC)监管的澳大利亚金融服务许可机构(AFSL No. 224663)。请阅读并理解我们的《金融服务指南》、《条款与条件》、《隐私政策》和其他披露文件,这些文件可在我们的网站 https://www.moomoo.com/au中获取。
在加拿大,通过moomoo应用提供的仅限订单执行的券商服务由Moomoo Financial Canada Inc.提供,并受加拿大投资监管机构(CIRO)监管。
在马来西亚,moomoo上的投资产品和服务是通过Moomoo Securities Malaysia Sdn. Bhd. 提供,该公司受马来西亚证券监督委员会(SC)监管(牌照号码︰eCMSL/A0397/2024) ,持有资本市场服务牌照 (CMSL) 。本内容未经马来西亚证券监督委员会的审查。
Moomoo Technologies Inc., Moomoo Financial Inc., Moomoo Financial Singapore Pte. Ltd., Futu Securities (Australia) Ltd, Moomoo Financial Canada Inc.,和Moomoo Securities Malaysia Sdn. Bhd.是关联公司。
- 分享到weixin
- 分享到qq
- 分享到facebook
- 分享到twitter
- 分享到微博
- 粘贴板
使用浏览器的分享功能,分享给你的好友吧