HSI breaks 25,000: Time to buy Hong Kong stocks?

Prince - September 11 morning market information, using technical analysis to determine trends (Prince Investment Notes)
Performance of the Hong Kong and Mainland China stock markets
$Hang Seng TECH Index (800700.HK)$The market closed at 5902.69 points, an increase of 73.95 points, representing a rise of 1.27%.
$Hang Seng China Enterprises Index (800100.HK)$ The market closed at 9328.16 points, an increase of 85.76 points, representing a rise of 0.93%.
$SSE Composite Index (000001.SH)$The market closed at 3812.22 points, an increase of 4.93 points, representing a rise of 0.13%.
$CSI 300 Index (000300.SH)$ The market closed at 4445.36 points, an increase of 9.11 points, representing a rise of 0.21%.
$Shenzhen Component Index (399001.SZ)$ The market closed at 12557.68 points, an increase of 47.08 points, representing a rise of 0.38%.
$BSE 50 (899050.BJ)$ The market closed at 1609.82 points, a decrease of 2.6 points, representing a decline of 0.16%.
$SSE Science and Technology Innovation Board 50 Index (000688.SH)$ The market closed at 1259.1 points, an increase of 13.57 points, representing a rise of 1.09%.
Closing price on September 10:
$Hang Seng Index (800000.HK)$ The index closed at 26,200.26 points, an increase of 262.13 points, representing a rise of 1.01%.$Hang Seng TECH Index (800700.HK)$The market closed at 5902.69 points, an increase of 73.95 points, representing a rise of 1.27%.
$Hang Seng China Enterprises Index (800100.HK)$ The market closed at 9328.16 points, an increase of 85.76 points, representing a rise of 0.93%.
$SSE Composite Index (000001.SH)$The market closed at 3812.22 points, an increase of 4.93 points, representing a rise of 0.13%.
$CSI 300 Index (000300.SH)$ The market closed at 4445.36 points, an increase of 9.11 points, representing a rise of 0.21%.
$Shenzhen Component Index (399001.SZ)$ The market closed at 12557.68 points, an increase of 47.08 points, representing a rise of 0.38%.
$BSE 50 (899050.BJ)$ The market closed at 1609.82 points, a decrease of 2.6 points, representing a decline of 0.16%.
$SSE Science and Technology Innovation Board 50 Index (000688.SH)$ The market closed at 1259.1 points, an increase of 13.57 points, representing a rise of 1.09%.
Daily trading volume:
Hong Kong: 288.209 billion
Shenzhen: 1.16 trillion
Shanghai: 82.1114 trillion
Beijing: 26.113 billion
The trading volume in both markets decreased compared to the previous trading day.
---------
Heavy trading zone for futures index:
Heavy commodity zone: 26,250 points
(The heavy trading zone can be referenced as a support or resistance level)
Consider the heavy trading area of the futures index as a support or resistance level. The primary reference is the distance to the heavy trading area both above and below, using a 150-point distance as a criterion. If the opening price on September 11 is above 26,400 points or if it has reached 26,400 points at any time during the day, the heavy trading area of 26,250 points will be used as a reference support level. Conversely, if the opening price on September 11 is below 26,100 points or if it has fallen below 26,100 points at any time during the day, the heavy trading area of 26,250 points will serve as a resistance level.
In addition to referencing the heavy trading zone for futures, it is also important to utilize technical analysis to identify support and resistance levels and to observe changes in the trends of major Hang Seng Index constituents.
----

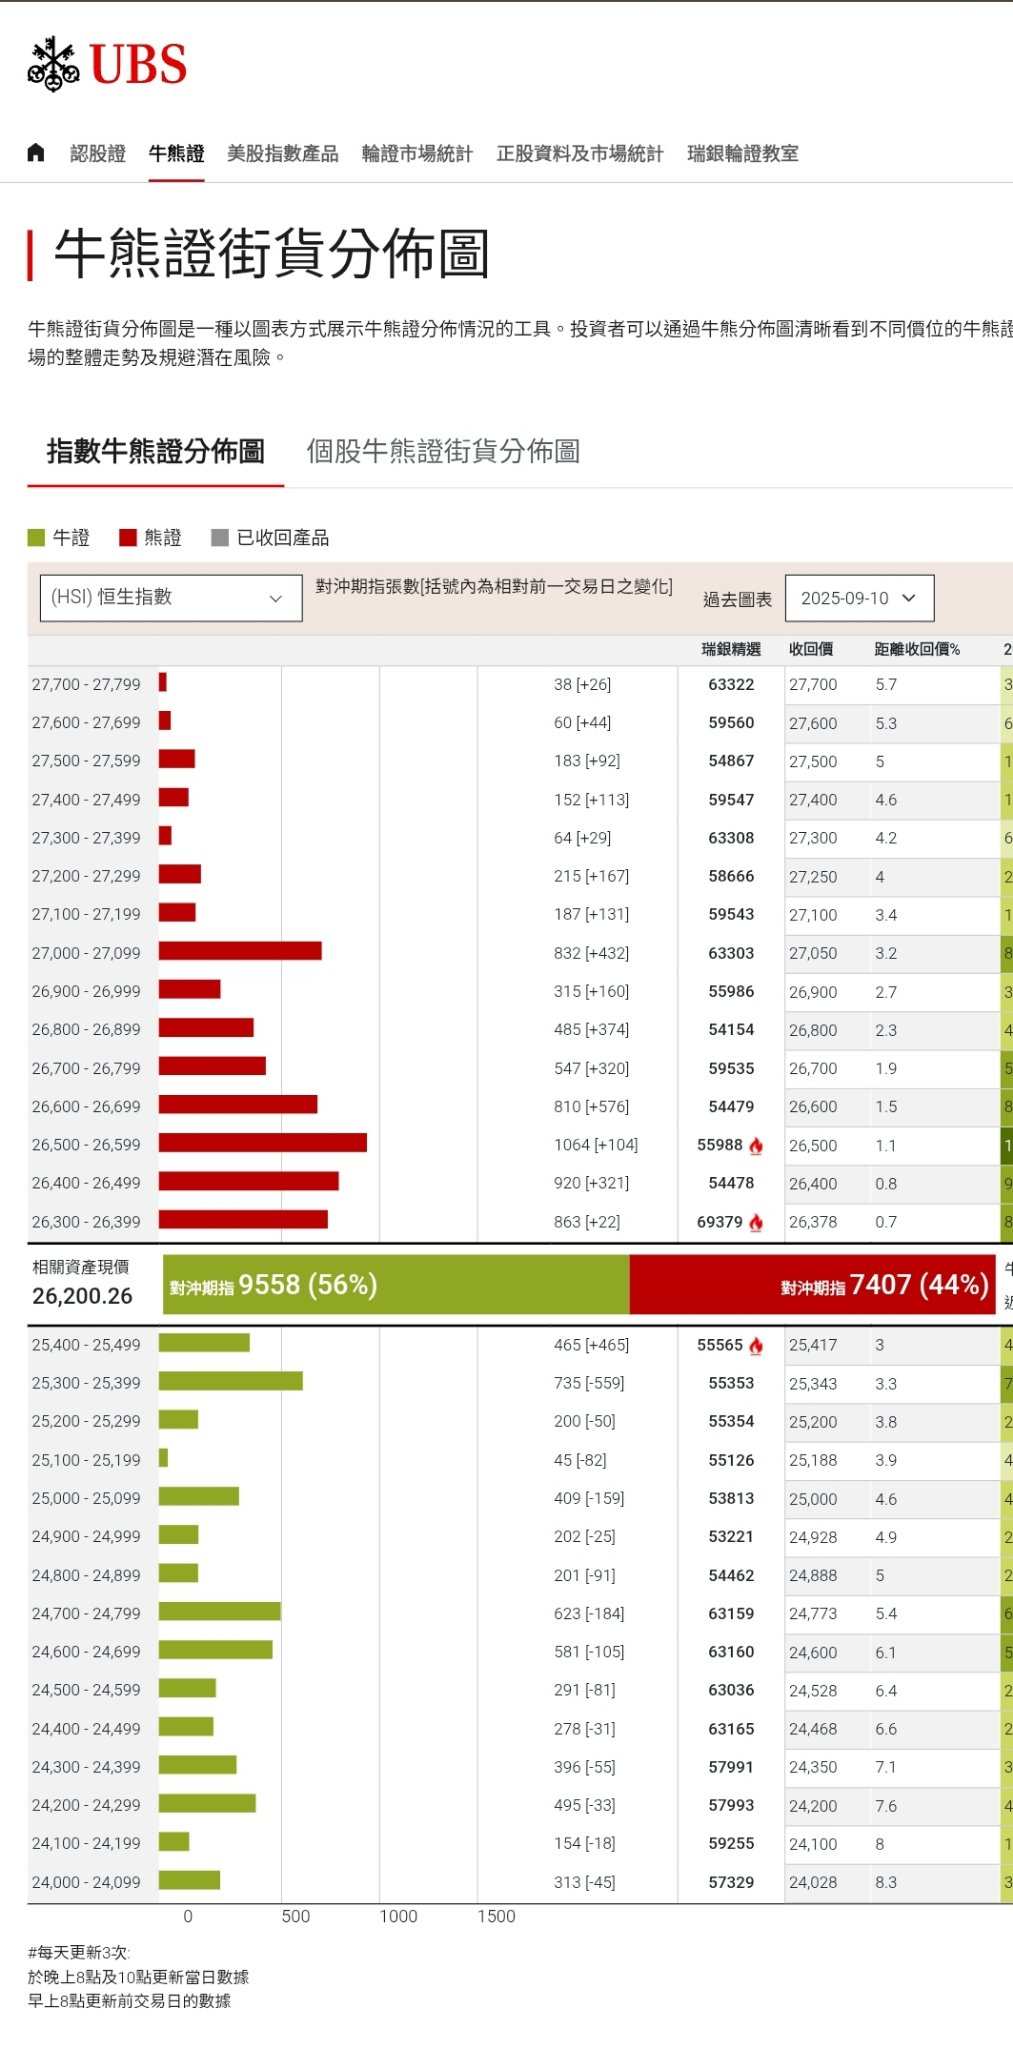
Distribution chart of callable bull/bear contracts at 8 AM on September 11:
Bull contracts: 56% (9,558 contracts)
Bear contracts: 44% (7,407 contracts)
The number of bull contracts has significantly decreased compared to the previous trading day, while bear contracts have increased.
Looking back at the distribution of bull and bear certificates over the past 10 trading days:
August 26: Bull certificates 65.8% : Bear certificates 34.2%
(On August 27, the Hang Seng Index fell by 323.16 points)
August 27 Bull Certificates 66.7%: Bear Certificates 33.3%
(On August 28, the Hang Seng Index fell by 202.94 points)
August 28 Bull Certificates 71.7%: Bear Certificates 28.3%
(On August 29, the Hang Seng Index rose by 78.8 points)
August 29: Bull Certificates 71.3% : Bear Certificates 28.7%
(On September 1, the Hang Seng Index rose by 539.8 points)
September 1: Bull Certificates 67.4%: Bear Certificates 32.6%
(On September 2, the Hang Seng Index fell by 120.87 points)
September 2: Bull Certificates 68.2%; Bear Certificates 31.8%
(On September 3, the Hang Seng Index fell by 153.12 points)
On September 3, Long Certificates accounted for 70.2% while Short Certificates accounted for 29.8%.
(On September 4, the Hang Seng Index fell by 284.92 points)
September 5: Bull certificates 67.3%: Bear certificates 32.7%
(On September 8, the Hang Seng Index rose by 215.93 points)
September 8, Bull Certificates 68.1%: Bear Certificates 31.9%
(On August 25, the Hang Seng Index rose by 304.22 points)
September 9: Bull certificates 64%: Bear certificates 36%
(On September 10, the Hang Seng Index rose by 262.13 points)
----
Distribution chart of bull and bear certificates listed on trading days from September 11 to 12:
September 11
Bull certificates range from 24,800 to 25,633 points.
Bear certificates range from 25,418 to 26,188 points.
September 12
Bull certificates from 25,100 to 25,938 points.
Bear certificates from 25,634 to 29,200 points.
The upcoming bull and bear certificates are exhibiting a trend of upward adjustment in their redemption prices.
-----
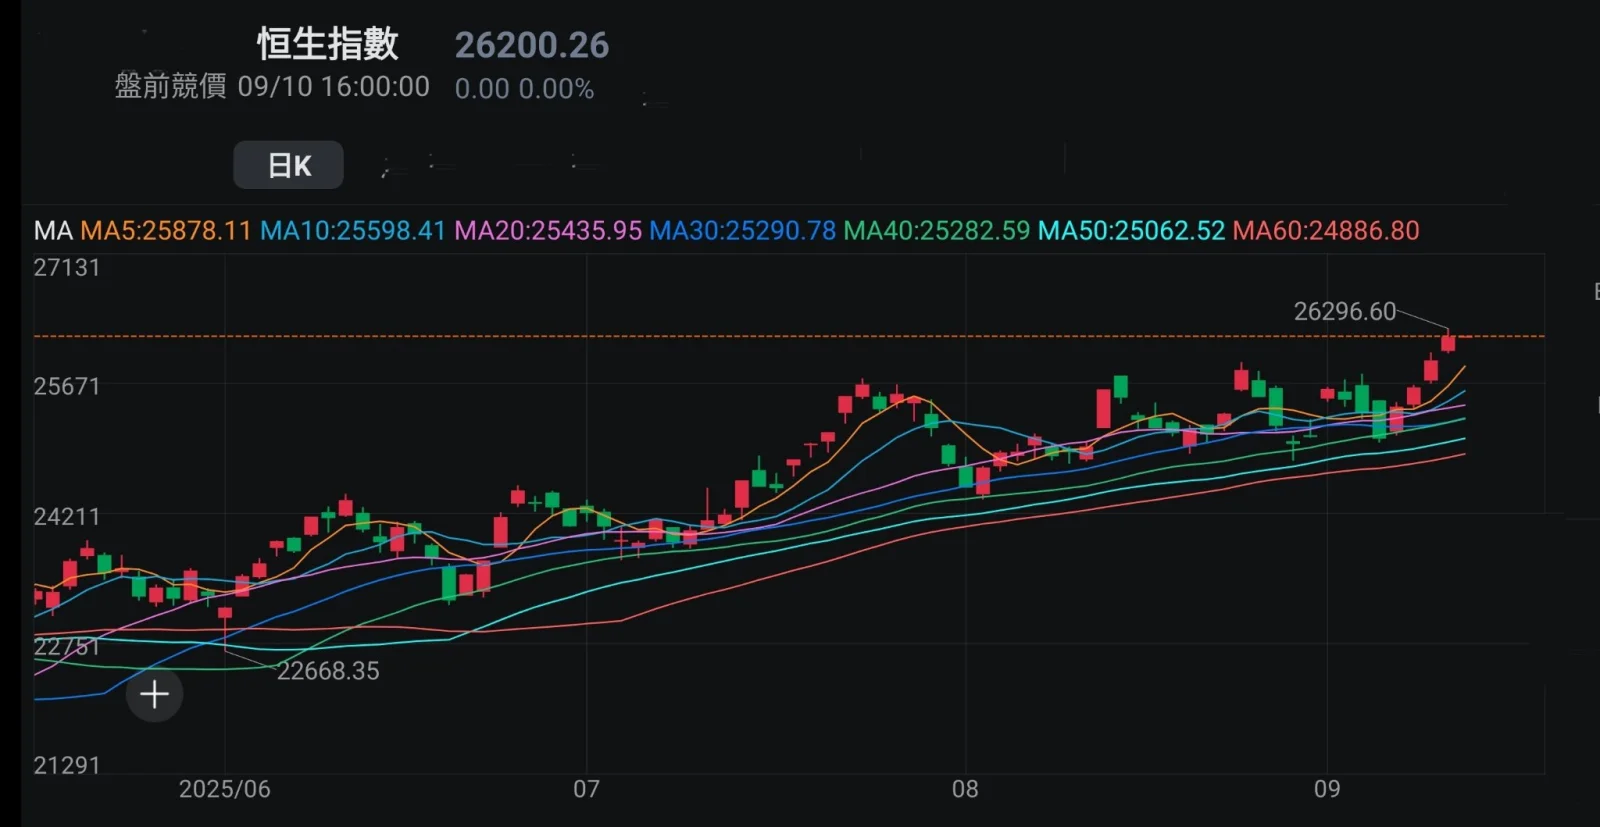
Note the changes in the moving average trend on the daily chart:
1)
The Hang Seng Index is above the 5, 10, 20, 30, 40, 50, and 60-day moving average lines, with multiple moving average lines trending upwards.
2)
The immediate support levels are: 5, 10, and 20-day moving average daily lines.
The primary short-term support level: 40-day moving average daily line.
3) Important support level: 60-day moving average daily line.
----
Daily chart:
As seen from the chart, the 60-day moving average of the Hang Seng Index has risen above the 24,800-point level.
Currently, the daily moving averages (5, 10, 20, 30, 40, 50, 60 days) and the 10-day weekly moving average are all above 24,800 points. Should it fall below 24,800 points, there is a chance to test the support level of the 20-day weekly moving average (approximately 24,300 points).
The short-term indicators for the Hang Seng Index, including MTM, KDJ, and RSI, show a positive trend, with the 6-day daily RSI above the value of 50, indicating strength.
The mid-term indicators for the Hang Seng Index, SAR and MACD, are showing positive trends.
----
The daily chart of the Hang Seng Index futures for this month shows the following short-term indicators:
Short-term indicators: MTM, KDJ, and RSI indicators are showing positive trends.
Mid-term indicators: SAR and MACD are showing positive trends.
----
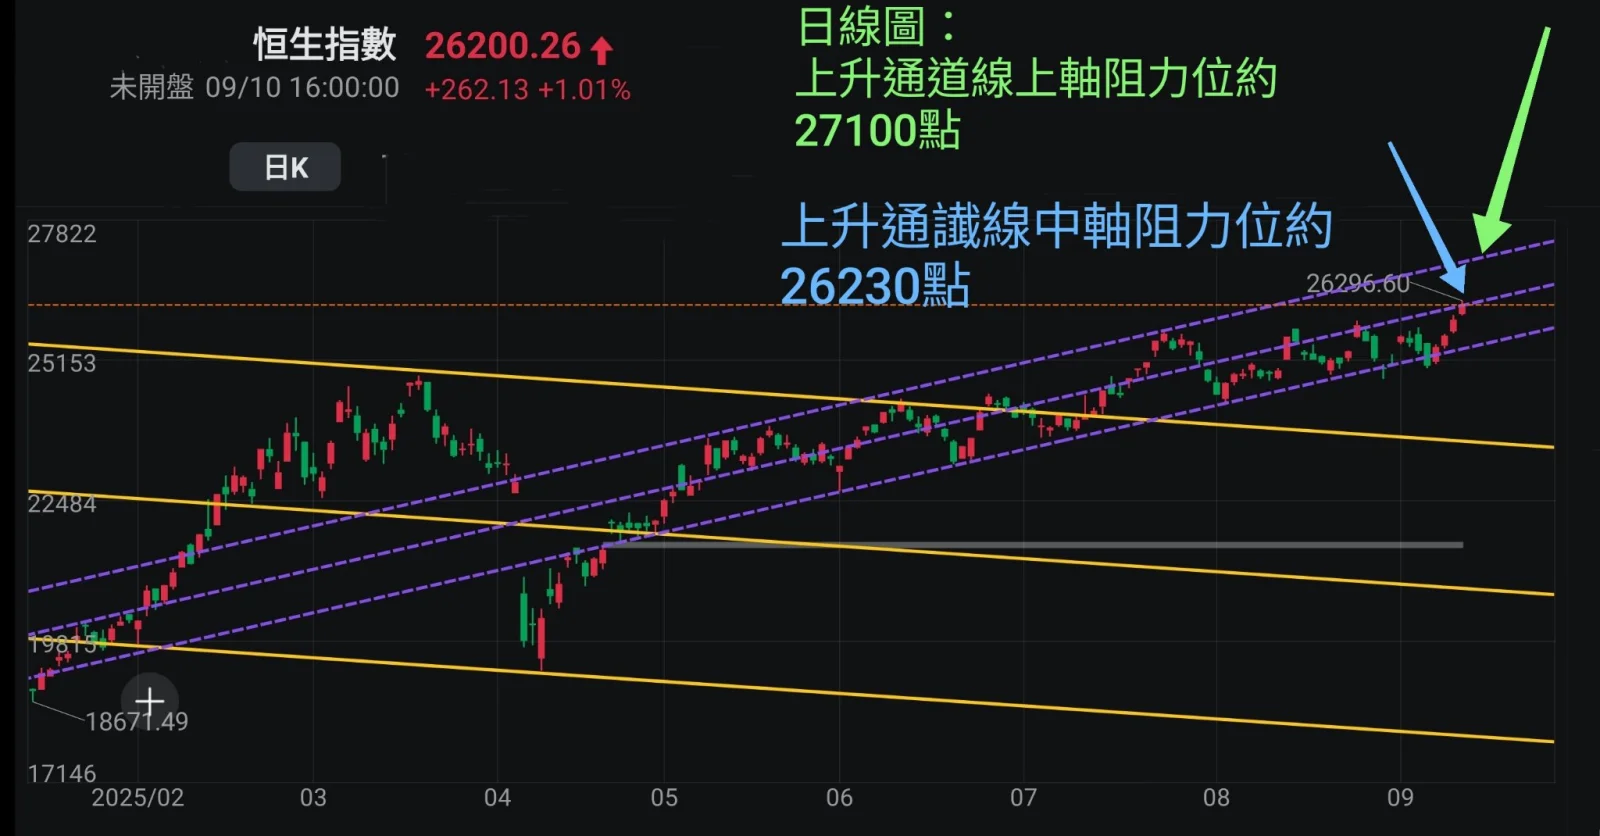
Daily Chart: Channel Lines
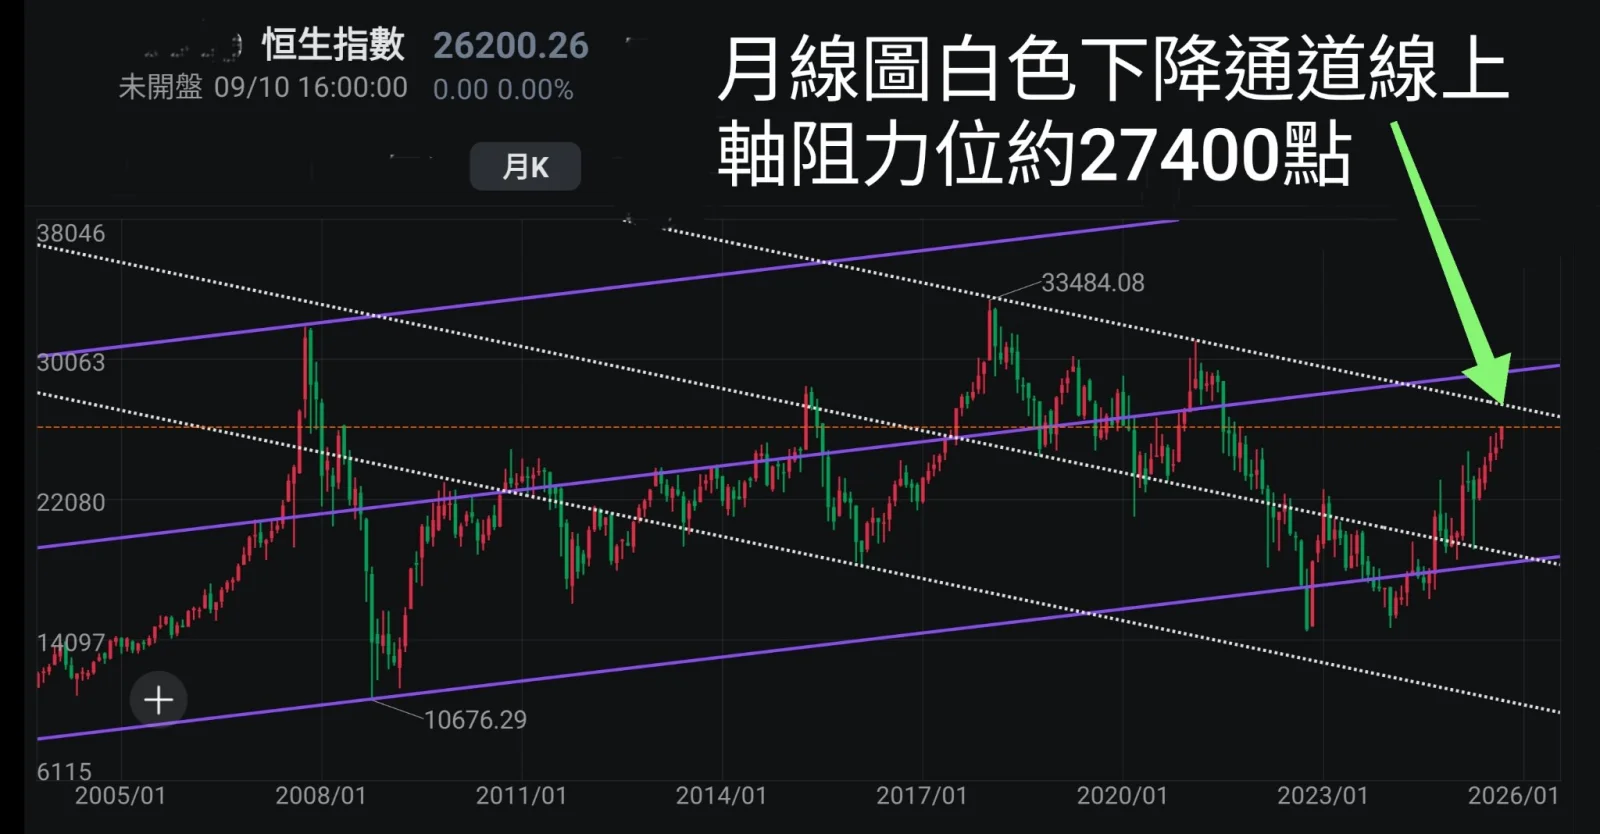
Monthly line chart channel diagram:
----
The inflow of Mandatory Provident Fund (MPF) into the market and monthly contributions to equity funds are driving the Hong Kong stock market upward, with the Hang Seng Index rising to 26,200 points. What will the market outlook be?
----
If one believes that the index is unlikely to rise or fall significantly from its current level, should one consider exchange-traded funds (ETFs) with covered call options instead? In the Hong Kong market, the ETFs with covered call options include:
Hang Seng Index:
Unsupported feature.
Please use the mobile app.
China Enterprises Index:
Unsupported feature.
Please use the mobile app.
Hang Seng Tech Index:
Unsupported feature.
Please use the mobile app.
The moving average lines in the charts of the three covered call option ETFs indicate a bullish arrangement, demonstrating strength. If the three ETFs maintain monthly dividend distributions, the annual yield exceeds 10%, which is indeed attractive.
-----
What is a covered call option?
Covered call options = simultaneously buying (spot + selling call options).
The benefit is: direct hedging reduces risk.
Assumptions:
If index futures rise, the short call will incur losses, but the profits from the futures contract will offset the losses from the short call, resulting in a profit from purchasing this ETF.
Assumptions:
If index futures decline, the short call will generate profits, although the drop in futures will lead to losses; however, compared to simply buying futures, the losses are smaller.
In the past, investors hesitated to enter due to the high entry barriers and risks associated with futures contracts, primarily because they were unsure of the best hedging strategies; now, with this type of ETF available, managing investments has become significantly easier.
Of course, if the relevant index declines in the future, purchasing covered call option ETFs may also present a significant risk of losses.
From the above data, the index-linked options ETF has a lower risk compared to the single-factor leveraged index ETF.
-----
To assess the market trend of Hong Kong stocks, it is essential to pay attention to the components of the Hang Seng Index: $TENCENT (00700.HK)$ , $HSBC HOLDINGS (00005.HK)$, $MEITUAN-W (03690.HK)$ , $HKEX (00388.HK)$ , $CHINA MOBILE (00941.HK)$ , $AIA (01299.HK)$ , $BABA-W (09988.HK)$ , $ICBC (01398.HK)$ , $BANK OF CHINA (03988.HK)$
To assess the market trend of Hong Kong stocks, it is essential to pay attention to the components of the Hang Seng Index: $TENCENT (00700.HK)$ , $HSBC HOLDINGS (00005.HK)$, $MEITUAN-W (03690.HK)$ , $HKEX (00388.HK)$ , $CHINA MOBILE (00941.HK)$ , $AIA (01299.HK)$ , $BABA-W (09988.HK)$ , $ICBC (01398.HK)$ , $BANK OF CHINA (03988.HK)$
----
"Happy Discussion on Finance" is a dynamic group where readers can express their views on the market, and Prince will also analyze the real-time trends of the market within the group.
Disclaimer: Community is offered by Moomoo Technologies Inc. and is for educational purposes only.Read more

Comments
to post a comment
18