CPI Gives No Surprise, 10Y Yield Nears 5%. What's Next?

Flow Focus | The Rebound Looks Good on the Surface — Underneath, the Yen Just Broke the Trade
The $S&P 500 Index (.SPX.US)$ closed Thursday less than 1% from its August all-time high, but the tape underneath was more selective. $Broadcom (AVGO.US)$ dropped 2.75% on a disappointing Q3. $Crude Oil Futures (DEC6) (CLmain.US)$ pushed toward $88, up more than 2%. $USD/JPY (USDJPY.FX)$ fell more than 2% in a single session on BOJ hike bets -- the sharpest yen move since August's Ministry of Finance intervention.
Waller said Thursday he would support holding at September 15-16, nudging the hike probability from ~63% to ~50% -- not far enough to close the door. The yen move carried intervention speculation alongside the BOJ repricing. And today, August NFP lands -- after a soft June and a negative July, the first payroll contraction in years.
(For more on the upcoming NFP: August NFP Preview: Both Tails Look Dangerous—Which One Are You Trading?)
The flow map this week is how money positioned ahead of all three.
The Double Squeeze Before the Print
The Warsh Fed has held at 3.50-3.75% with PCE still well above target. Waller's Thursday lean was toward a hold -- not a pivot. The problem is sequencing: a strong August NFP makes a September hike nearly unavoidable, while a third consecutive weak print against elevated PCE is the stagflation box -- no clean move in either direction.
Japan adds independent timing pressure. The yen's surge was mechanical -- BOJ hike expectations raised the cost of yen borrowing, forcing liquidation of carry-funded dollar positions. Consumer Discretionary, Airlines, and high-multiple software were the crowded destinations. Not a fundamental re-rating. Forced exit driven by FX.
Index ETFs: Hedged for CPI, Not NFP

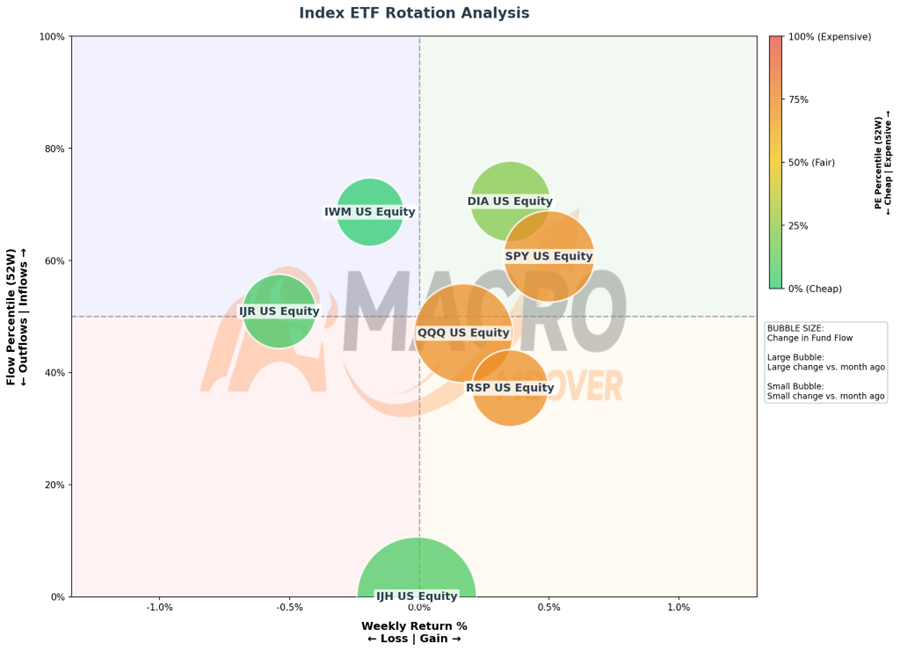
The flow split tells the story directly. $Invesco QQQ Trust (QQQ.US)$ collapsed from peak inflows a month ago to mid-range this week -- the institutional carry bid for tech unwinding even as the index held within striking distance of all-time highs. $iShares Core S&P Mid-Cap ETF (IJH.US)$ fell even harder, from near-maximum inflows a month ago to an absolute flow floor. The carry drain is hitting the growth and mid-cap layer the hardest.
$SPDR S&P 500 ETF (SPY.US)$ held its flows better -- improving from a lower base to the upper half of its range. $State Street® SPDR® Dow Jones Industrial Average® ETF Trust (DIA.US)$ stayed elevated. $iShares Russell 2000 ETF (IWM.US)$ was stable. The broader market bid is holding; the concentration is in the tech and growth unwind. $Invesco Exchange Traded Fd Tr S&P 500 Equal Weight Etf (RSP.US)$ also saw modest flow improvement, suggesting the rotation into non-tech names is beginning to show up in the equal-weight layer.
The options picture adds a layer heading into a busy macro calendar. $Invesco QQQ Trust (QQQ.US)$ put/call open interest ratio sits at 1.26, $SPDR S&P 500 ETF (SPY.US)$ at 2.44 -- both put-heavy, with SPY's structural hedging significantly deeper. Implied volatility remains in the low double digits, well below realized vol. Put protection is in place but was purchased at leisure, not in panic. With CPI on September 11 and FOMC on September 15-16, that gap between existing hedges and cheap implied vol is the setup to watch.
Sector Rotation: Carry Forces the Exit
Two sectors carry the week's signal in mirror image.

$Energy Select Sector SPDR Fund (XLE.US)$ was the standout -- the single most dramatic flow reversal among all eleven sectors, surging from near-minimum to near-maximum inflows in a month. $Exxon Mobil (XOM.US)$, $Chevron (CVX.US)$, and $ConocoPhillips (COP.US)$ all participated. Real cash flows, no rate duration, cheap valuation: exactly the profile institutions reach for when carry-funded positions are liquidating.
$Consumer Discretionary Select Sector SPDR Fund (XLY.US)$ was the mirror -- flows collapsed from near-peak to the lower zone, one of the largest outflow bubbles on the chart. $Amazon (AMZN.US)$, $Nike (NKE.US)$, and $Tesla (TSLA.US)$ absorbed selling from carry unwind and rate-fear simultaneously. US retail data has not broken. The yen-funded positioning structure underneath it has.
Industry Rotation: Real Assets In, Levered Beta Out
The sector chart gives the macro frame. The industry chart is the precision layer.

$VanEck Oil Services ETF (OIH.US)$ -- largest bubble on the chart, most extreme single-month flow surge on the board. $Halliburton (HAL.US)$, $SLB Ltd (SLB.US)$, and $Baker Hughes (BKR.US)$ anchored it. Targeted upstream accumulation, not passive sector flow.
$VanEck Agribusiness ETF (MOO.US)$ -- strongest weekly return of any industry, inflows near peak. $Deere (DE.US)$, $The Mosaic (MOS.US)$, and $Archer Daniels Midland (ADM.US)$ led. Commodity real assets are natural destinations when yen-funded dollar flows evaporate.
$U.S. Global Jets ETF (JETS.US)$ -- near-peak inflows a month ago, exit-zone now, sharp weekly decline. $Delta Air Lines (DAL.US)$, $United Airlines (UAL.US)$, and $Southwest Airlines (LUV.US)$ in the carry crossfire. Travel demand intact; the carry trade is doing the selling.
$iShares US Home Construction ETF (ITB.US)$ -- hit from both angles. Rate fear crushed mortgage demand; peak valuations offered no cushion. $D.R. Horton (DHI.US)$, $Lennar Corp (LEN.US)$, $PulteGroup (PHM.US)$ posted the second-worst weekly decline. Rate duration plus crowded positioning: the cleanest double-squeeze casualty on the board.
What to Watch From Here
– Apple event September 9 -- 7.68% of $Invesco QQQ Trust (QQQ.US)$, 7.23% of $SPDR S&P 500 ETF (SPY.US)$. The first iPhone launch under new CEO John Ternus carries outsized index weight. A strong cycle update moves QQQ meaningfully on its own. But the blast radius extends well beyond $Apple (AAPL.US)$ -- watch suppliers $Taiwan Semiconductor (TSM.US)$, $Qualcomm (QCOM.US)$, $Micron Technology (MU.US)$ , and $Broadcom (AVGO.US)$ , the same Broadcom that dropped 2.75% on its own earnings this week.
– CPI September 11 -- last print before FOMC. Hot CPI plus a strong NFP today makes a September hike nearly certain. Soft CPI gives Warsh room to hold. Watch $Invesco QQQ Trust (QQQ.US)$ implied vol expand as put buyers pay up into the release.
– FOMC September 15-16 -- Warsh's credibility moment. Warsh defends the inflation-fighting cycle or signals the labor market won. Homebuilders, Software, and REITs are priced for ambiguity. A hike extends their pain; a hawkish hold holds the line.
– BOJ hike and hard-asset follow-through. A confirmed move extends the carry unwind -- structurally good for Energy and Agriculture. Two to three weeks of sustained inflows confirms the regime shift; one week of reversal reads as tactical noise.
The positioning map is drawn. Carry is cracking, CPI is next week, and September 15-16 is Warsh's last clear shot at defending the rate cycle. The flow data shows where money already moved -- the question is whether the macro delivers the confirmation.
General ETF disclosure: Before investing in an ETF, you should read both its summary prospectus and its full prospectus, which provide detailed information on the ETF's investment objective, principal investment strategies, risks, costs, and historical performance (if any). You can find prospectuses on the websites of the financial firms that sponsor a particular ETF, as well as through your broker. Investment returns will fluctuate and are subject to market volatility, so that an investor's shares, when redeemed or sold, may be worth more or less than their original cost. ETFs are subject to market volatility and the risks of their underlying securities, which may include the risks associated with investing in smaller companies, international securities, commodities, fixed income, and more. An ETF may trade at a premium or discount to its net asset value (NAV).
Disclaimer: Moomoo Technologies Inc. is providing this content for information and educational use only.Read more


Comments (3)
to post a comment
33
7