
Tonight at 9:30 PM, the CPI release could trigger a sharp market shift! Crude oil nearing $110, US 10-year Treasury yield approaching 5%. Will tonight overturn the "70% probability of a September rate hike"?
Ahead of next week's US Federal Open Market Committee (FOMC) meeting, the debate over inflation has reached its critical peak. The US Producer Price Index (PPI) for August rose 0.4% month-on-month and 5.4% year-on-year, largely in line with market expectations. However, this indicated that the impact of soaring energy prices had already begun to ripple through as upward pressure on prices from the upstream. Brent crude rose to just below $109 per barrel,
As the yield on the US 10-year Treasury note approaches 5%,
the probability of a rate hike at the September meeting has risen to approximately 70% in the interest rate futures market.
However, there remains a possibility that the US Consumer Price Index (CPI) released on the 11th could completely change this scenario.Market expectations are for headline CPI to rise by about 0.4% month-on-month and core CPI by 0.2%. If core inflation stays around the expected 0.2%, views will strengthen that underlying inflationary pressures are being contained despite higher oil prices, potentially bringing the pricing of a September rate hike back closer to a 50-50 chance. On the other hand, if core accelerates to 0.4%, the hurdle for the Fed to skip further rate hikes would rise sharply.
This uncertainty is clearly reflected in the options market. While significant hedging against equity index declines remains in the stock market, gold is also gaining prominence as a secondary macro hedge.
PPI Is Not a Shock; The Real Problem Is Oil
The PPI figure itself was by no means disastrous. Goods prices rose by 1.1%, but the main driver was a 4.2% surge in energy prices, while service prices increased by only 0.1%. Core final demand, excluding food, energy, and trade services, also rose by a relatively moderate 0.3%.
The issue lies in the changes that occurred in the crude oil market after August's price data was measured. Brent crude surged more than 6% in just 10 days to $107.63, while WTI crude also broke through the $100 mark.The market is increasingly pricing in shipping disruptions around the Strait of Hormuz and attacks on energy infrastructure in the Gulf region not as temporary supply glitches, but as prolonged supply risks.
The bond market's reaction has been severe. The yield on the US 10-year Treasury note rose to approximately 4.97%, nearing the significant 5% threshold. Although the US Treasury expanded its planned buyback amount for long-term bonds to $6 billion—triple the previous amount—it failed to curb rising interest rates. The message from the US Treasury market is clear: investors are beginning to believe that limited bond buybacks alone cannot offset the triple pressure of inflation, fiscal deficits, and energy risks.
That is precisely why this CPI release serves as a decisive litmus test.
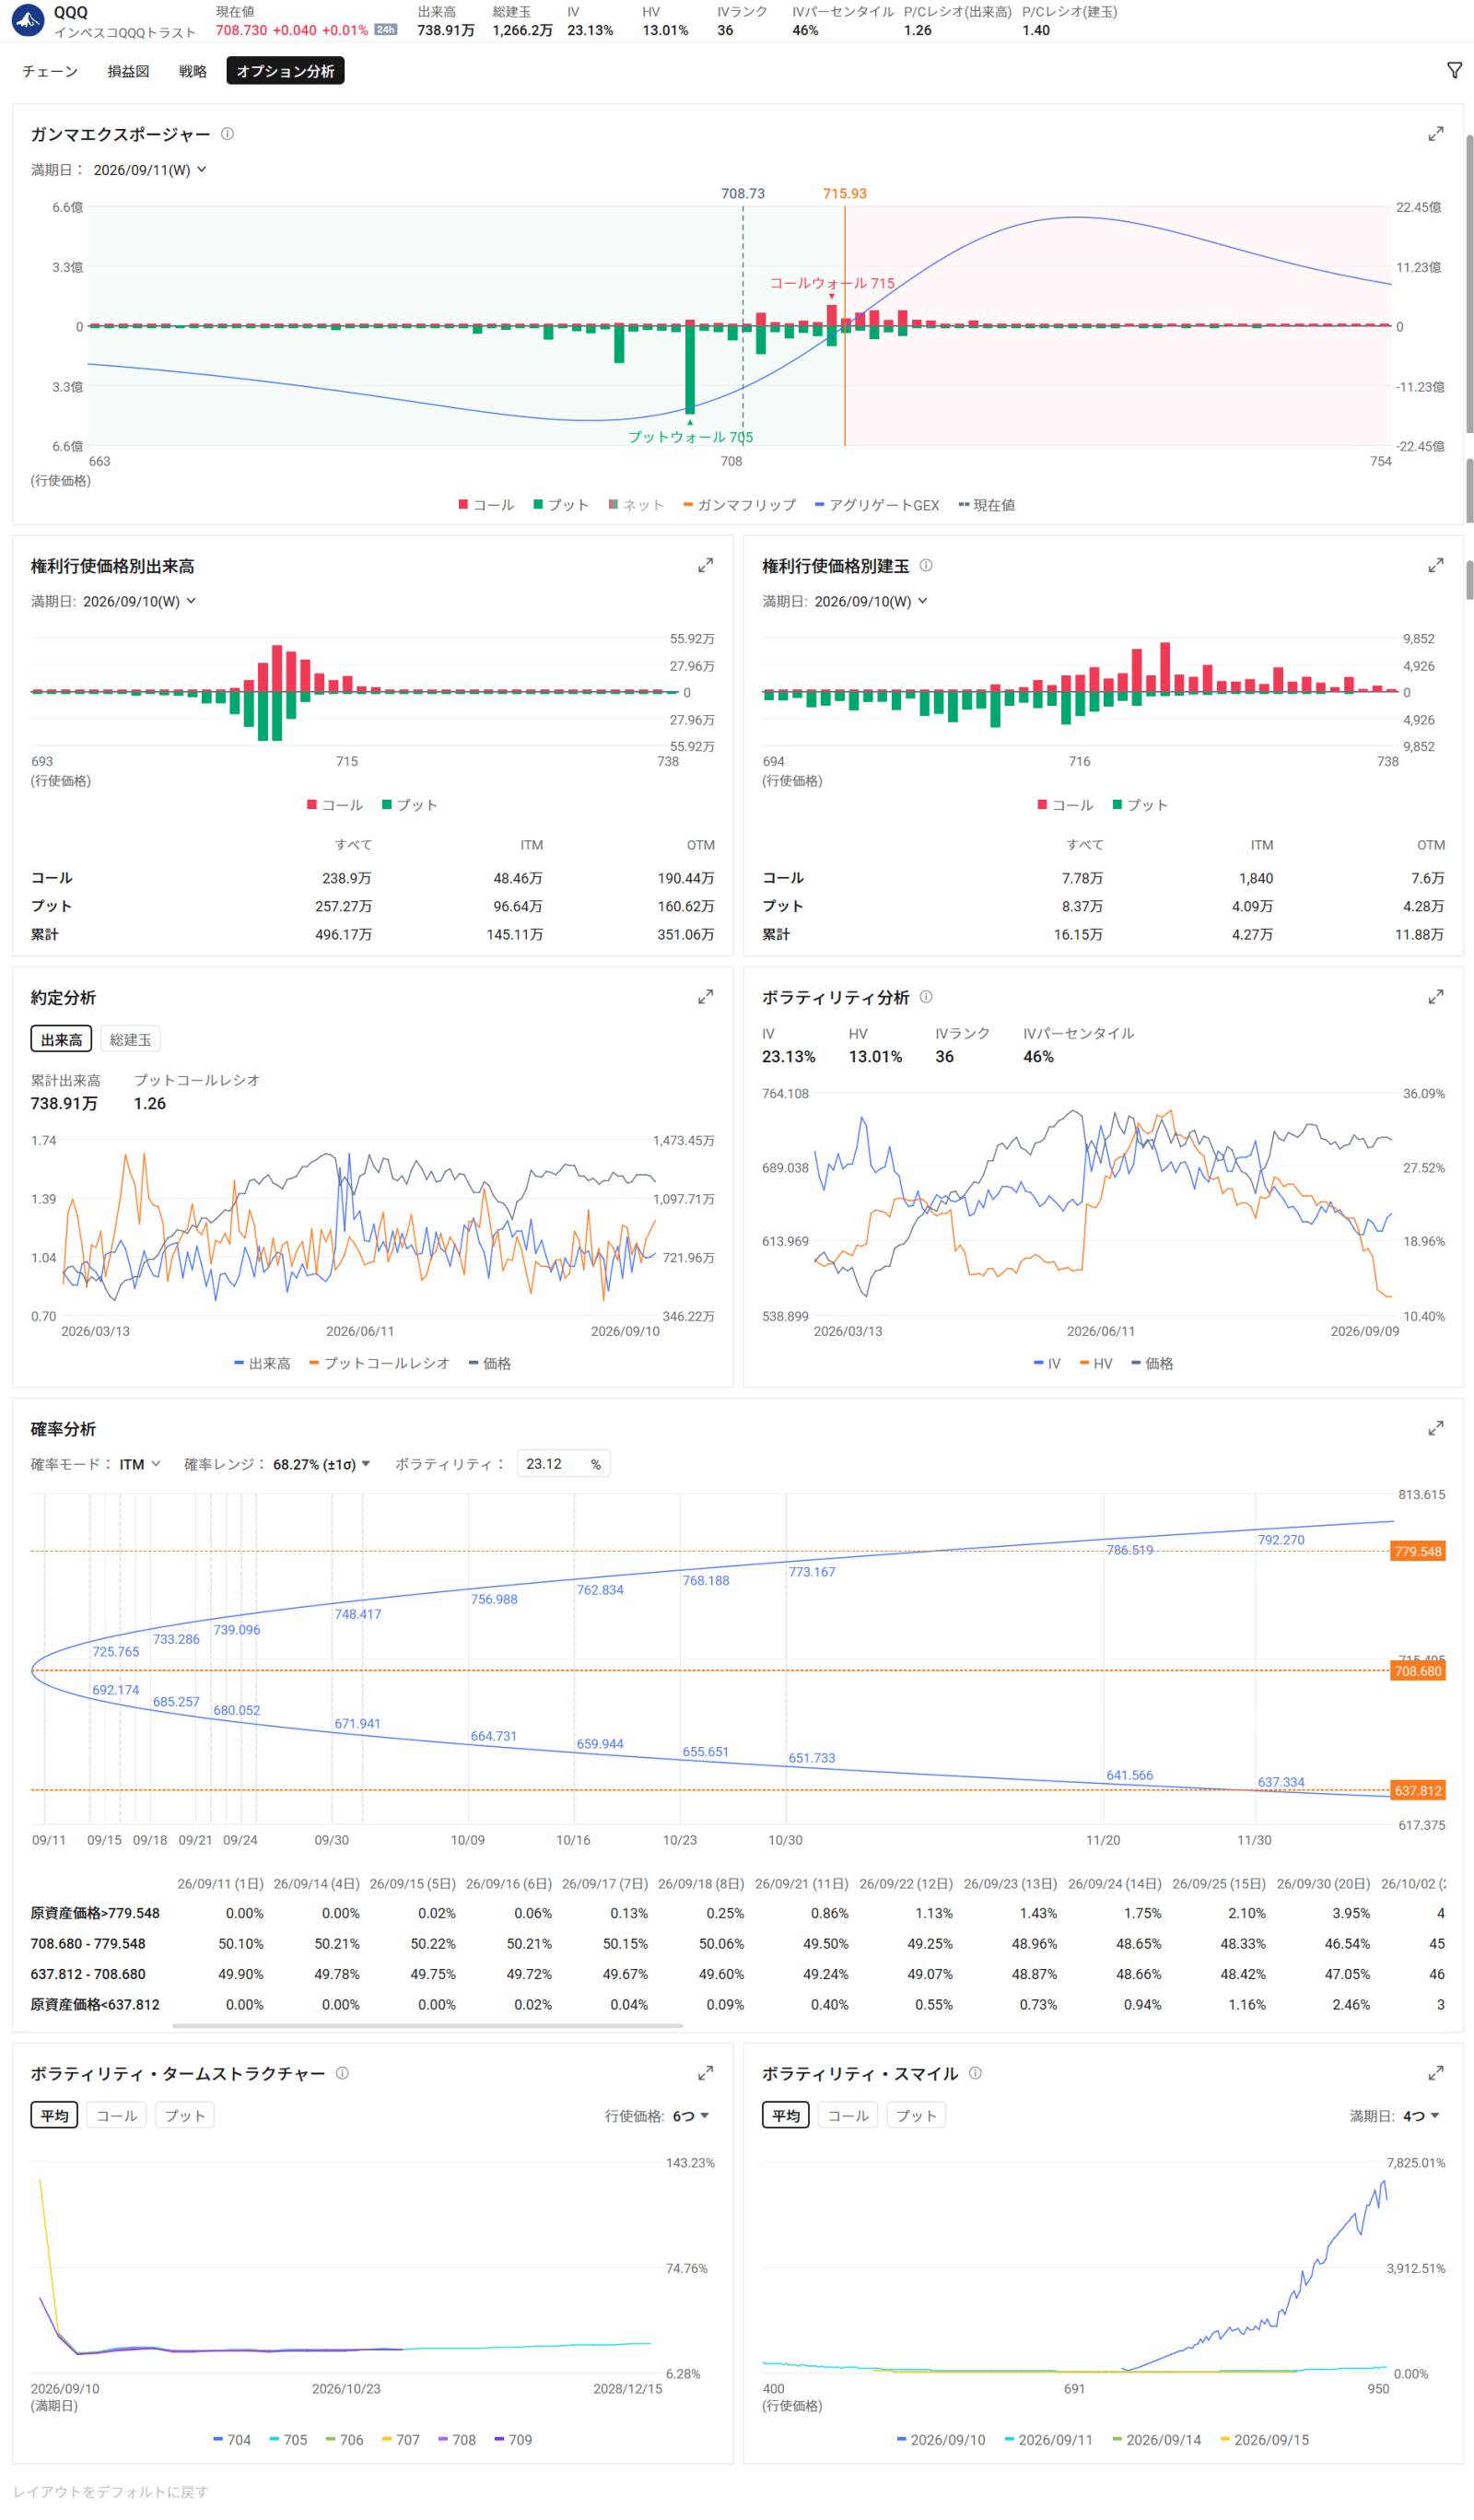
The volume-based put/call ratio stands at 1.26, while the open interest-based ratio is 1.40. Option positioning is concentrated near the current price, with a put wall forming around $705 and a call wall around $715. The current price is also very close to the estimated gamma flip level, placing the Nasdaq-100 in a position where price movements are likely to be amplified by major macro events such as the CPI release.
Implied volatility has risen to 23.13%, significantly exceeding the historical volatility of 13.01%. This indicates that investors are paying a considerable premium to insure against downside risk ahead of the CPI data.

QQQ Option Positioning
Figure 1: QQQ option positioning before the CPI announcement. The volume-based put/call ratio is 1.26, and the open interest-based ratio is 1.40. A put wall at $705 and a call wall at $715 bracket the current price, while implied volatility is significantly higher than recent realized volatility.
This is not panic; it is strictly insurance. If the CPI figures are benign, the accumulated hedges could unwind rapidly.Conversely, if the data comes in hot, that insurance will be immediately justified.
Gold hedges risks distinct from those of equities.
Positioning in gold shows a more complex structure.$SPDR Gold ETF (GLD.US)$ Trading around $397.15,
Positioning in gold shows a more complex structure.$SPDR Gold ETF (GLD.US)$ Trading around $397.15,
The volume-based put/call ratio is 1.11, indicating a slight put bias, while the open interest-based ratio stands at just 0.48.Recent trading has turned defensive, but calls still dominate across existing positions overall.
There is a put wall near $400 and a call wall near $405, with the estimated gamma flip level situated higher, around $410. GLD's implied volatility is 28.43%, nearly on par with its historical volatility of 27.81%, but the IV percentile has risen to 73%.

GLD Option Positioning
Figure 2: GLD Option Positioning. Recent volume has tilted slightly toward puts, while calls remain dominant in open interest. The current price is below the $400 put wall and the $405 call wall, as conflicting factors—inflation concerns and rising real yields—battle it out in the gold market.
Gold plays a different role than QQQ. Puts on stock indices serve as hedges against falling asset prices, whereasgold is increasingly used as an asset to hedge against scenarios where inflation, fiscal deterioration, and geopolitical risks remain elevated, and policy authorities face limits in their response capabilities.However, buying gold is not simply a play on inflation. If real rates surge due to upside surprises in CPI, gold could face downward pressure.
A more favorable tailwind for gold would be a situation where inflation remains stubbornly high while market skepticism grows regarding how aggressively governments and central banks can respond.
The clearest portfolio hedge in SPY
Among the three, SPY shows the clearest defensive posture.$SPDR S&P 500 ETF (SPY.US)$ It is trading around $759.38,
Among the three, SPY shows the clearest defensive posture.$SPDR S&P 500 ETF (SPY.US)$ It is trading around $759.38,
with a volume-based put/call ratio of 1.33. Even more striking is the open interest-based ratio of 2.51, indicating that existing positions are heavily hedged against downside risk.
There is a put wall near $760 and a call wall near $765, with the estimated gamma flip level at approximately $768.16. The current price is slightly below the put wall and also below the gamma flip level. Implied volatility has risen to 17.59%, more than double the historical volatility of 8.40%.

SPY Option Positioning
Figure 3: SPY option positioning before the CPI release. The volume-based put/call ratio is 1.33, while the open interest-based ratio is 2.51. The current price is near the $760 put wall and below the $765 call wall. Implied volatility is also significantly higher than recent realized volatility.
This clearly indicates that investors are not entering the CPI release unprotected. While maintaining equity exposure, they are explicitly building up insurance at the index level.
The potential for CPI to completely alter the premise of a "September rate hike"
The market is currently pricing in approximately a 70% probability of a 0.25% rate hike at next week's FOMC meeting. This is a significant increase from the roughly 60% level seen before the PPI release on the 10th and the surge in crude oil prices. However, this probability remains heavily dependent on a single figure: the CPI.

Data as of: 2026.09.11
If core CPI comes in around 0.2% month-on-month, as expected, the Fed will need to distinguish between energy shocks caused by external factors and underlying domestic inflation. The view that "crude oil prices exceeding $100 alone are not sufficient justification for an immediate rate hike" is gaining traction, which could bring the probability of a rate hike back closer to 50-50.
If the figure is 0.3%, the debate will continue. However, if it overshoots to 0.4%, the implications change significantly. With job numbers already showing robust growth and the unemployment rate holding at 4.1%, the Fed would have both an economic environment capable of withstanding further rate hikes and inflation metrics that justify them. Fed Governor Christopher Waller has also hinted that he may lean toward supporting additional rate hikes if inflation results remain sufficiently strong.This is precisely why today's CPI release carries significant weight.
The market is already positioning itself for the "answer."
The message from three options markets is consistent. In QQQ, clear downside hedges are accumulating, while SPY shows even heavier portfolio defense. Gold sees strengthening short-term defensive postures, although medium- to long-term positions remain bullish. Underpinning all these positions is a U.S. Treasury market that refuses to calm down.
Crude oil at $100 is no longer the only key threshold. Brent crude is already approaching $110. The next major level the market will likely focus on could be the 5% mark for the U.S. 10-year Treasury yield.
If the CPI comes in moderate, U.S. Treasury yields could decline, and expectations for a September rate hike may recede.In that scenario, the massive index hedges accumulated in QQQ and SPY could be rapidly unwound, potentially amplifying the rise in stock prices.
Conversely, if the CPI overshoots, the market will be forced to accept a harsher combination of factors.Strong employment, crude oil exceeding $100, sticky inflation, and additional rate hikes.
Over the next 24 hours, the CPI will effectively determine which "regime" the market enters next.
This article uses machine translation in part
-moomoo News Zeber
-moomoo News Zeber
This document is prepared solely for informational purposes and does not constitute a recommendation to invest in or trade any specific financial instrument. Investors are solely responsible for their own final investment decisions and the resulting outcomes. Financial instruments carry risks including price volatility, credit risk, and liquidity risk. Principal is not guaranteed and losses may occur. The company assumes no liability whatsoever for any damages arising from the use of this document or from investment decisions made based on its content. Option trading involves the risk of losses exceeding the initial investment. Please be sure to review all key documentation—including the Contract Pre-Conclusion Document, Subscription Agreement, and other materials—covering important matters such as risks and fees, and trade only at your own discretion.
Disclaimer: Moomoo Technologies Inc. is providing this content for information and educational use only.Read more


Comments
to post a comment
21
13