
3Ren Berhad: Can Key Structural Support Halt the Current Correction?

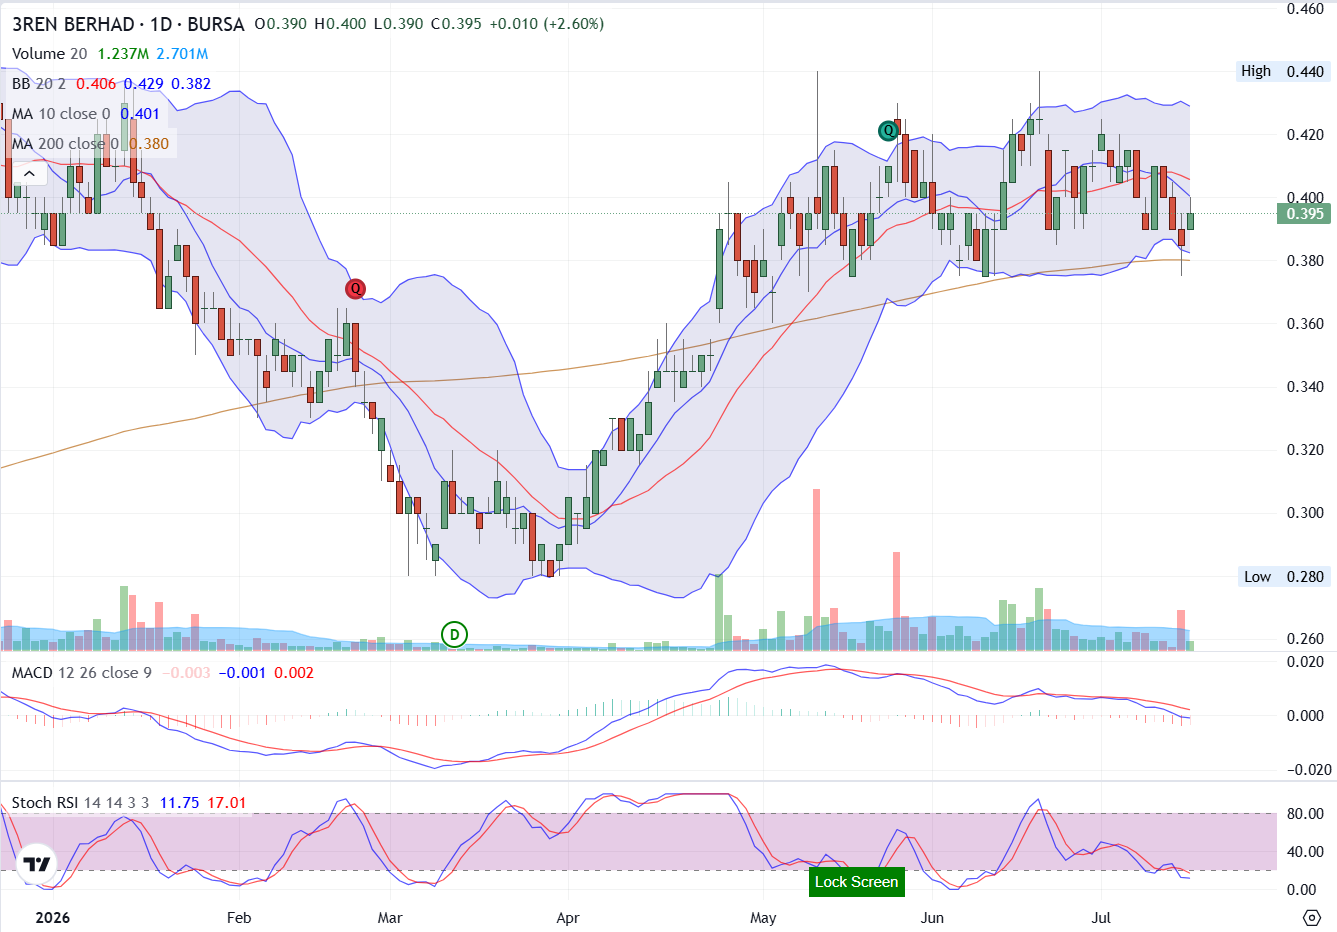
3Ren Berhad (Bursa: 3REN, 0328), an automation solutions and engineering services provider catering to the semiconductor industry, is currently traversing a critical technical juncture on its daily chart. After staging a powerful rally out of its March lows and peaking near the RM0.440 mark, the stock has entered a multi-week corrective phase. As the price drifts downward to test key long-term moving averages, markets are closely monitoring whether this pullback represents a healthy accumulation zone or a structural trend breakdown.
The most vital technical feature on the chart is the descending-turned-flat 200-day Moving Average (MA 200), represented by the orange line sitting precisely at RM0.380. The recent price decline has brought the stock down to RM0.395, placing it just a few ticks above this major institutional support level.
Conversely, the 10-day Moving Average (MA 10) at RM0.401 (blue line) and the middle Bollinger Band (basis) at RM0.406 have flipped into immediate overhead resistance. The price action over the last few sessions shows the stock struggling to reclaim the MA 10, signaling that short-term sellers still maintain temporary control.
The price is actively hugging the lower Bollinger Band (RM0.382). When candles slide down the lower band alongside a narrowing band width, it indicates a steady, low-volatility bleed rather than panic selling. The proximity of the lower band to the MA 200 creates a highly defined dual-support confluence zone between RM0.380 and RM0.382.
On the other hand, the MACD line is currently hovering just beneath the zero center-line. This negative shift confirms that the bearish momentum triggered during the June peak has successfully taken hold of the medium-term trend. The red histogram bars are extended below the zero line, validating the ongoing distribution. However, a closer look shows that the histogram's downward slope is beginning to flatten out. For a trend reversal to materialize, traders need to see the red bars shrink significantly, followed by a definitive bullish crossover of the blue MACD line back above the red signal line.
While the MACD highlights structural weakness, the Stochastic RSI has plunged deep into the lower extreme boundaries. The blue line is currently printing at 11.75, while the red line sits slightly higher at 17.01. Any reading beneath the 20.00 threshold indicates an intensely oversold environment where selling pressure is statistically overextended. The fact that the oscillator is bottoming out at the exact moment the price is approaching the MA 200 support floor (RM0.380) creates a compelling setup. It indicates that the selling momentum is rapidly running out of steam just as it encounters a major historical buying zone.
In conclusion, 3Ren Berhad is currently exhibiting a classic textbook "pullback-to-support" trading configuration. While the MACD clearly warns that sellers hold the intermediate keys, the severe compression against the lower Bollinger Band combined with a deeply oversold Stochastic RSI indicates the downward move is reaching its limit. If the structural floor at RM0.380 successfully cushions the current sell-off, 3Ren Berhad could be perfectly coiled for a meaningful technical rebound in the near term.
Disclaimer: Community is offered by Moomoo Technologies Inc. and is for educational purposes only.Read more

Comments (4)
to post a comment
1